An epic season
I’ve been on many rides and raced in many races I’d classify as “epic”, but this is probably the first season I’d classify as “epic”. Lots of epic rides and races, but also one epic crash completely changed the course of my season. I’m super thankful to be able to write this post at all after slamming into the side of a car on a 25% section of a descent on South Cove Dr on a Monday commute home from work, waking up in the hospital, and then spending the rest of the week there. In addition to all of that, I created two new websites: di2stats.com for analyzing shifting data from Shimano Di2 shifters and howmuchtogo.com for tracking progress towards goals.
I had again this year been planning on targeting the SRS series on the road and the UltraCX series off-road with an additional goal of qualifying for the Race Across America for 2015, but when my good buddy Kyle Taylor asked me if I wanted to race 24 hour mountain bike nationals, which would lead to several conflicts with the SRS series, I decided to switch to a season with more of an off-road and ultra distance emphasis. This started out well with Rouge Roubaix followed up by an epic Hell of the South race. One week later, I won the 500 mile Heart of the South race. Things turned upside down just after the Cohutta 100 mtb race where two days later I had my bad wreck on the way home from work.
When I woke up in the hospital, I didn’t know what all I had broken, but I was sure that my season was over. Instead, the only long term consequence was broken ribs and a broken jaw. Even after surgery, my jaw still had to be wired shut for nearly two months. But since my legs were OK, I could ride again only a week after coming home from the hospital. Riding with my jaws wired shut was quite disconcerting because there was no way to get any more oxygen if I ran out by climbing too steep a hill or pushing it too hard to make a traffic light.
I think in the end this helped me out at 24 hour mtb nationals which was held at 8000′ of elevation in the beautiful enchanted forest in the mountains above Gallup, NM. I had almost two months of riding with my jaw wired shut before begging the surgeon to remove the wires the week before the race. I never noticed the altitude during the race, but I did have to sleep for a couple hours in the middle of the night, which dropped me from the top 5 out of the top ten. I woke up feeling really refreshed though and passed several people to end up 7th by the time the race was over.
After this race, I switched gears thinking about qualifying for RAAM and started doing long adventure rides as training (and for the adventure, too, of course!). This included four weeks in a row of back-to-back-to-back epics totaling almost 1200 miles in just 4 rides – starting with one of the crazier adventures of the year – racing elite amateur nationals in Madison, Wisconsin followed by a 315 mile ride through the hills of southwestern, western, and northwestern Wisconsin leaving at 1 in the morning barely 10 hours after finishing the 90 mile road race. One week later, I reversed the route and headed back down towards Madison but got caught in a bad thunderstorm that dropped the temps down into the lower 50s. Here I am in Wisconsin absolutely frozen trying to drink enough coffee at a gas station to try to warm up in the middle of July!!!
The next weekend back home in Alabama I rode down to the beach for a beach vacation via Alabama and Florida’s high points. It was a tough ride with 16,000+ ft of climbing with a painful leg infected from a bee sting on a ride the day before. The swelling was bad enough and getting worse after the 310 mile ride that we ended up in the emergency room the next day (three days after the bee sting) to scan for blood clots. So this year already had two emergency room visits by the middle of July.
After a fun beach vacation, I rode 333 miles back home hitting the Florida and Alabama high points again. This concluded four weekends in a row of long adversity rides done on very little sleep.
So less than a month later, when it was time to race the Mid-Atlantic 24 hour time trial to qualify for RAAM. I felt more than ready. I ended up leading for a good portion of the race, but fading by the end after pushing the pace way too hard to see if I could break 9 hours for 200 miles. I knew that it would cost me by the end, but I figured you don’t get too many chances to do that, given how flat and fast the course was. I ended up 3rd riding 444 miles over the 24 hour period, which earned me a spot in the 2015 edition of RAAM!
After one more trip to the beach (this time in a car) to race the Pensacola Cycling Classic, I switched into mountain biking and ultra cross racing mode, racing the Fool’s Gold 100, Oak Ass 100, and Gravel Grovel. In the middle of all that, I won the Alabama state road race, a couple of really cool Gran Fondos, and the Tour de Cullman. This year I rode up from Birmingham to Cullman, won the race, and then rode back home – a 209 mile adventure with a race in the middle!
One final addition to this year’s season was a pair of everestings – riding repeats on a single hill enough time to climb the height of Mount Everest on a single ride. Strava put out a climbing challenge in November, and the Hells 500 guys upped the ante by offering a special medallion for those who completed an everesting during the climbing challenge. Scott Cole from up in Vermont completed THREE everestings during the competition, whereas I was only able to complete one everesting – karl daly. Even so, I was able to place 3rd in the world for the climbing challenge and 1st in the US based on many, many, many, many repeats of the double oak roller coaster.
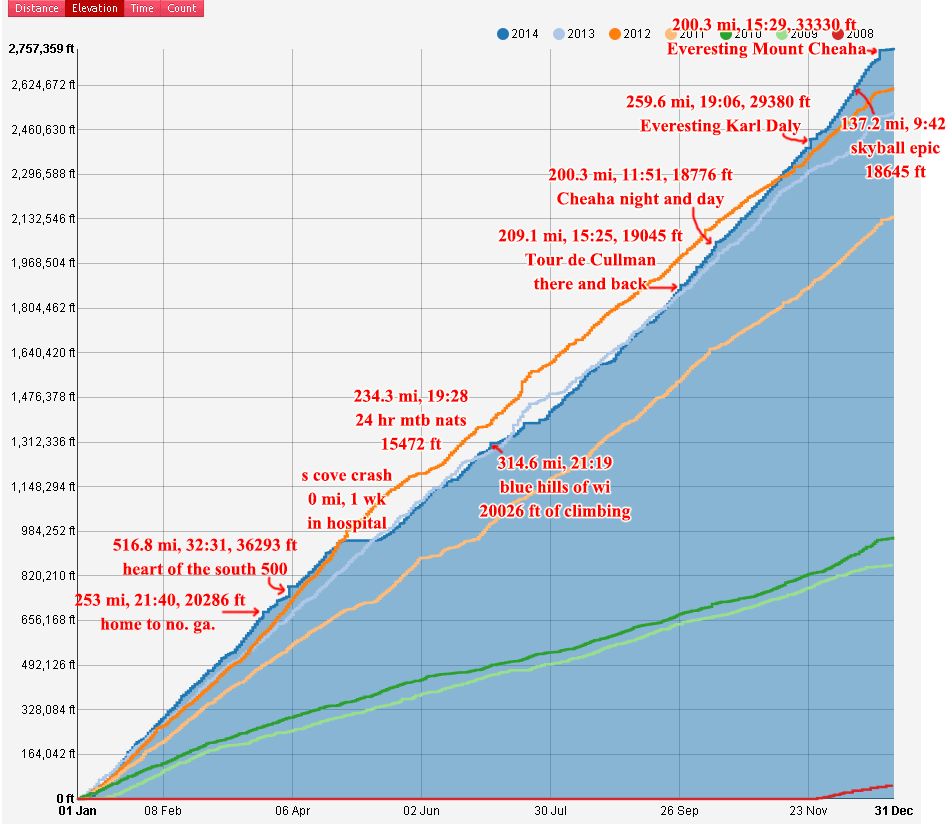
Towards the beginning of December after the climbing challenge was over, I looked at my stats on veloviewer and realized I could possibly hit 2.75 million feet of climbing for the year if I climbed a lot in December — which is tricky because of our annual trip up to Wisconsin for the last week of December. I created a spreadsheet to help me track my progress which eventually led to the creation of a new website (howmuchtogo.com). The picture below is after I completed the goal via everesting Mount Cheaha climbing 33,330 feet (over 10,000 meters) the night before and into the day we left for Wisconsin.
 howmuchtogo.com – 2014 elevation goal 2.75 million feet
Calendar year statistics
I compiled these statistics and graphs from the cool strava api app called veloviewer.com. These statistics are from the 2014 calendar year. Probably the most notable part of these stats is the two weeks off the bike after my April 28th accident on S Cove Dr. I was so fortunate to not only be able to recover from that crash, but also set new yearly personal records for most distance (22,056 miles), most climbing (2,757,359 feet), most 200+ mile rides (11), longest ride (516.8 miles), but surprisingly not the most monthly climbing (April 2012 – 310,000 feet) or most weekly riding (July 2012 – 649.5 miles).
Season statistics
The statistics below all run from October 28, 2013 until October 26, 2014 – 364 days worth of riding and racing. In the past I have defined my racing/training season from the Monday closest to Nov 1 of the previous year to the Sunday closest to Oct 31st of the current year for all of these statistics and reports. But with the addition of late fall mountain bike and ultra cross races, it no longer covers the entire season. This will probably be the last year that I calculate the statistics on a non-calendar year.
Statistics Summary
October 28, 2013 – October 26, 2014
| Statistic | Avg | Max | Min | Total |
|---|---|---|---|---|
| Weekly training time (hours) | 29:56 | 41:32 | 0:00 | 1527:11 |
| Weekly distance (miles) | 415.2 | 631.9 | 0.0 | 21,175 |
| Ride distance (miles) | 44.6 | 516.8 | 0.1 | 21,175 |
| Workouts per week (#) | 9 | 16 | 2 | 475 |
| Weekly climbing (feet) | 45,233 | 70,955 | 0 | 2,306,910 |
For eagle-eyed observers who note that the climbing total is lower than that reported on Strava, I will give the same explanation that I gave last year and the year before (and the year before that): I am generating these reports from my Polar Protrainer software. I wrote a converter that converts Garmin .FIT files and .TCX files into the .HRM format that Polar expects. The Polar Protrainer software then applies a smoothing filter when it is calculating total ascent and other statistics, but I can’t figure out how to turn it off so that the statistics match up with Strava, which doesn’t apply any smoothing filters.
Comparison to past years
All years run from the Monday closest to November 1st to the Sunday closest to October 31st. This should result in about 365 days for each year give or take a day or two.
| Statistic (per week) |
2008 Avg/Max |
2009 Avg/Max |
2010 Avg/Max |
2011 Avg/Max |
2012 Avg/Max |
2013 Avg/Max |
2014 Avg/Max |
|---|---|---|---|---|---|---|---|
| Time (hours) | 14.0/20.2 | 13.4/20.8 | 15.4/20.9 | 22.4/33.0 | 25.7/40.9 | 27.8/34.3 | 29.9/41.5 |
| Dist (miles) | 238/337 | 242/369 | 266/380 | 338/503 | 390/649 | 394/586 | 415/632 |
| HR avg (bpm) | 137/165 | 139/161 | 136/176 | 131/178 | 123/156 | 122/162 | 123/166 |
| Workouts (#) | 11/15 | 9/14 | 11/14 | 11/17 | 12/19 | 11/17 | 9/16 |
| Climb (feet) | 13k/20k | 14k/29k | 14k/23k | 31k/52k | 44k/89k | 42k/70k | 45k/71k |
| Statistic (yearly total) |
2008 Total |
2009 Total |
2010 Total |
2011 Total |
2012 Total |
2013 Total |
2014 Total |
|---|---|---|---|---|---|---|---|
| Training (hours) | 726 | 698 | 798 | 1,167 | 1,336 | 1,445 | 1,527 |
| Distance (miles) | 12.4k | 12.6k | 13.8k | 17.6k | 20.3k | 20.5k | 21.2k |
| Workouts (#) | 560 | 445 | 546 | 580 | 632 | 554 | 475 |
| Climbing (feet) | 661k | 677k | 750k | 1,598k | 2,298k | 2,196k | 2,307k |
Trends
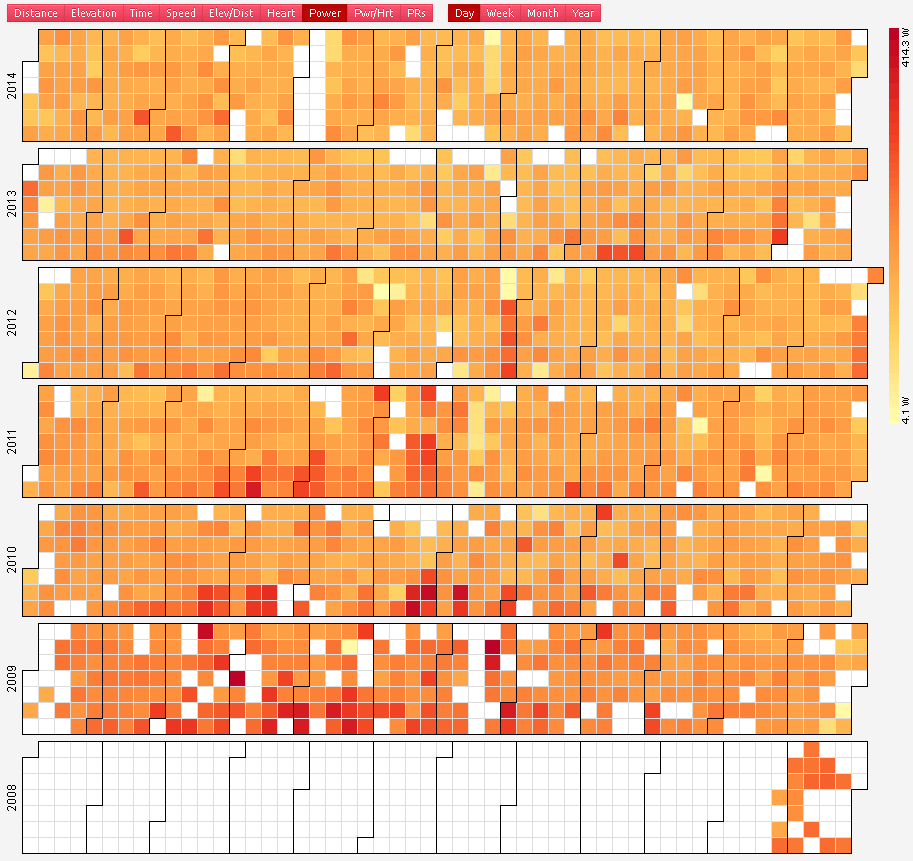
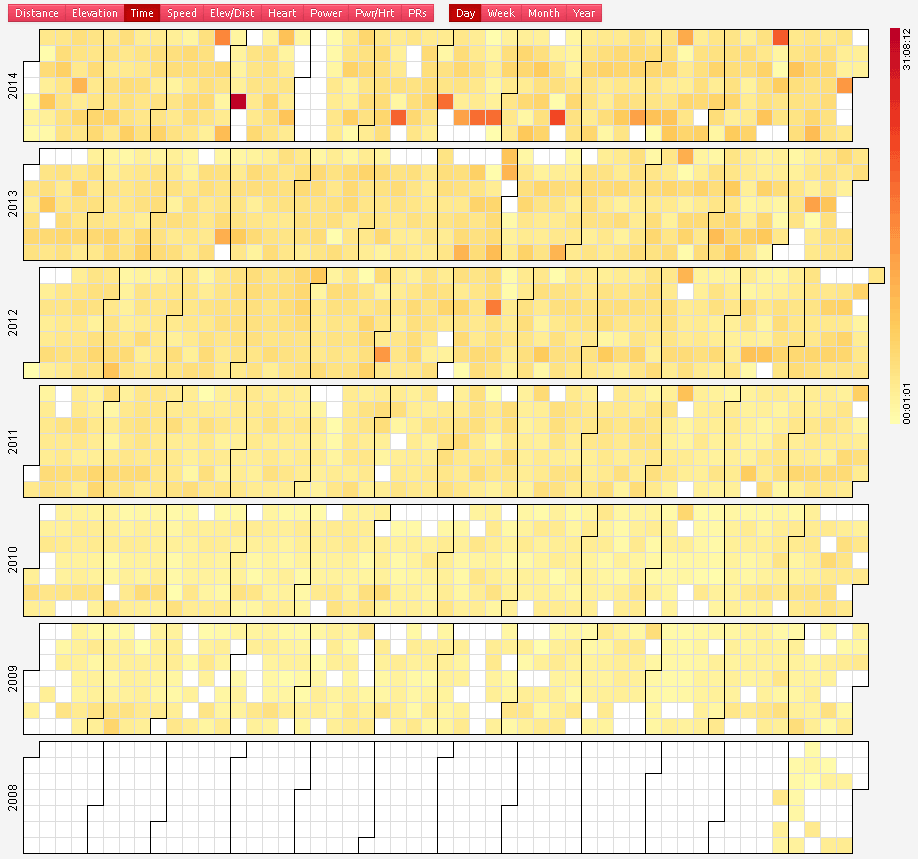
It is interesting to note from the two veloviewer graphs below how the intensity of my workouts has decreased as my volume has increased. Hidden in that data, though, is that even with a ride with an average power of 125 watts, there may be a 500 watt two minute effort or a 400 watt 7 minute effort that helps keep my racing edge in tact. But I don’t know how much longer that will last so it will be interesting to see if I can still maintain those highest intensities in races in the future once I have finished with RAAM next year. I am so excited for RAAM, though, it doesn’t really matter too much to me right now to think that my regular racing is going to take a big hit (possibly permanently, which means I may be joining the masters fields soon instead of the Pro/1/2 fields). No matter what, though, I still love to ride my bike which is probably the most important stat of all!!!
 2014 annotated distance graph – this is probably my favorite graph because you can most clearly see all the epic rides from this year plus the back-to-back-to-back-to-back weekends of epics in the summer.
 2014 annotated elevation graph – the pair of everestings at the end of the season really stand out in this graph.
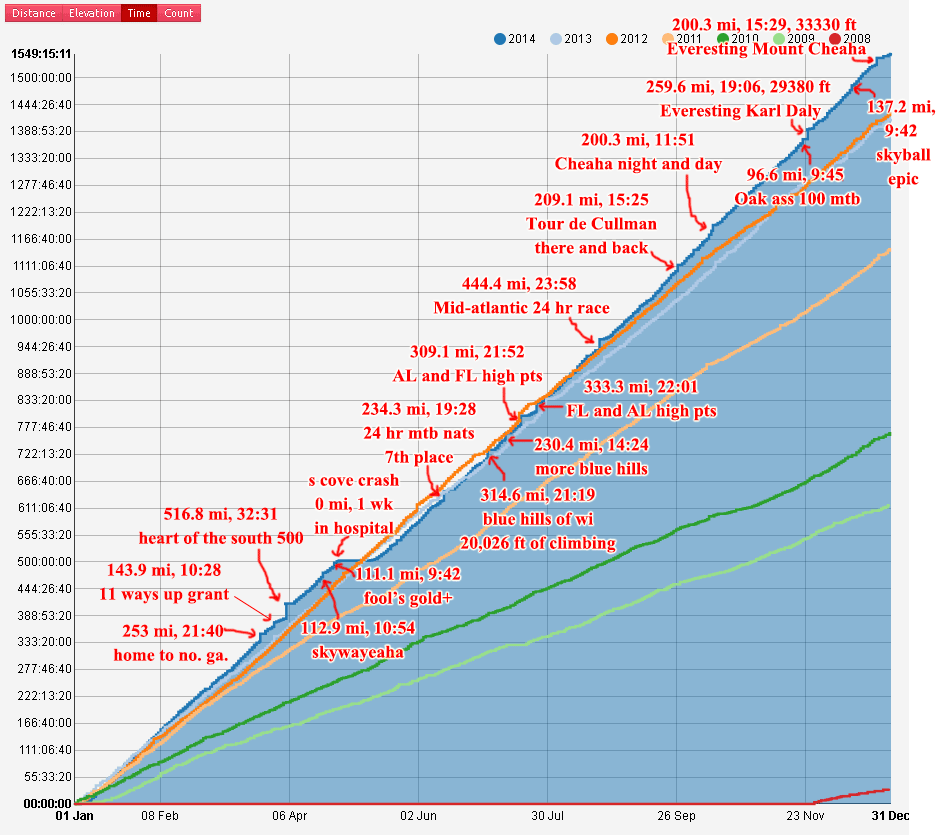
 2014 annotated time graph – one trend to note here is how this more closely relates to the elevation graph than the distance graph. in other words time and distance aren’t as closely related when you are climbing a TON. in other other words – you can spend 4 hours riding 80 miles in flat ground or 4 hours riding 40 miles in extremely hilly terrain, but it will still on average take 4 hours to climb 10,000 feet no matter the distance.
 2014 annotated ride count – you can see the start and finish of the semesters at Samford based on when I switch from 1 ride per day to 2 rides per day. Thanks to the gran fondo challenges introduced this year on Strava, I decided to keep my fall commutes as one ride which dramatically reduced the count of fall rides for this year.

Leave a Reply