 Cahaba river pedestrian bridge behind the ballfields (plus iBike Newton pic)
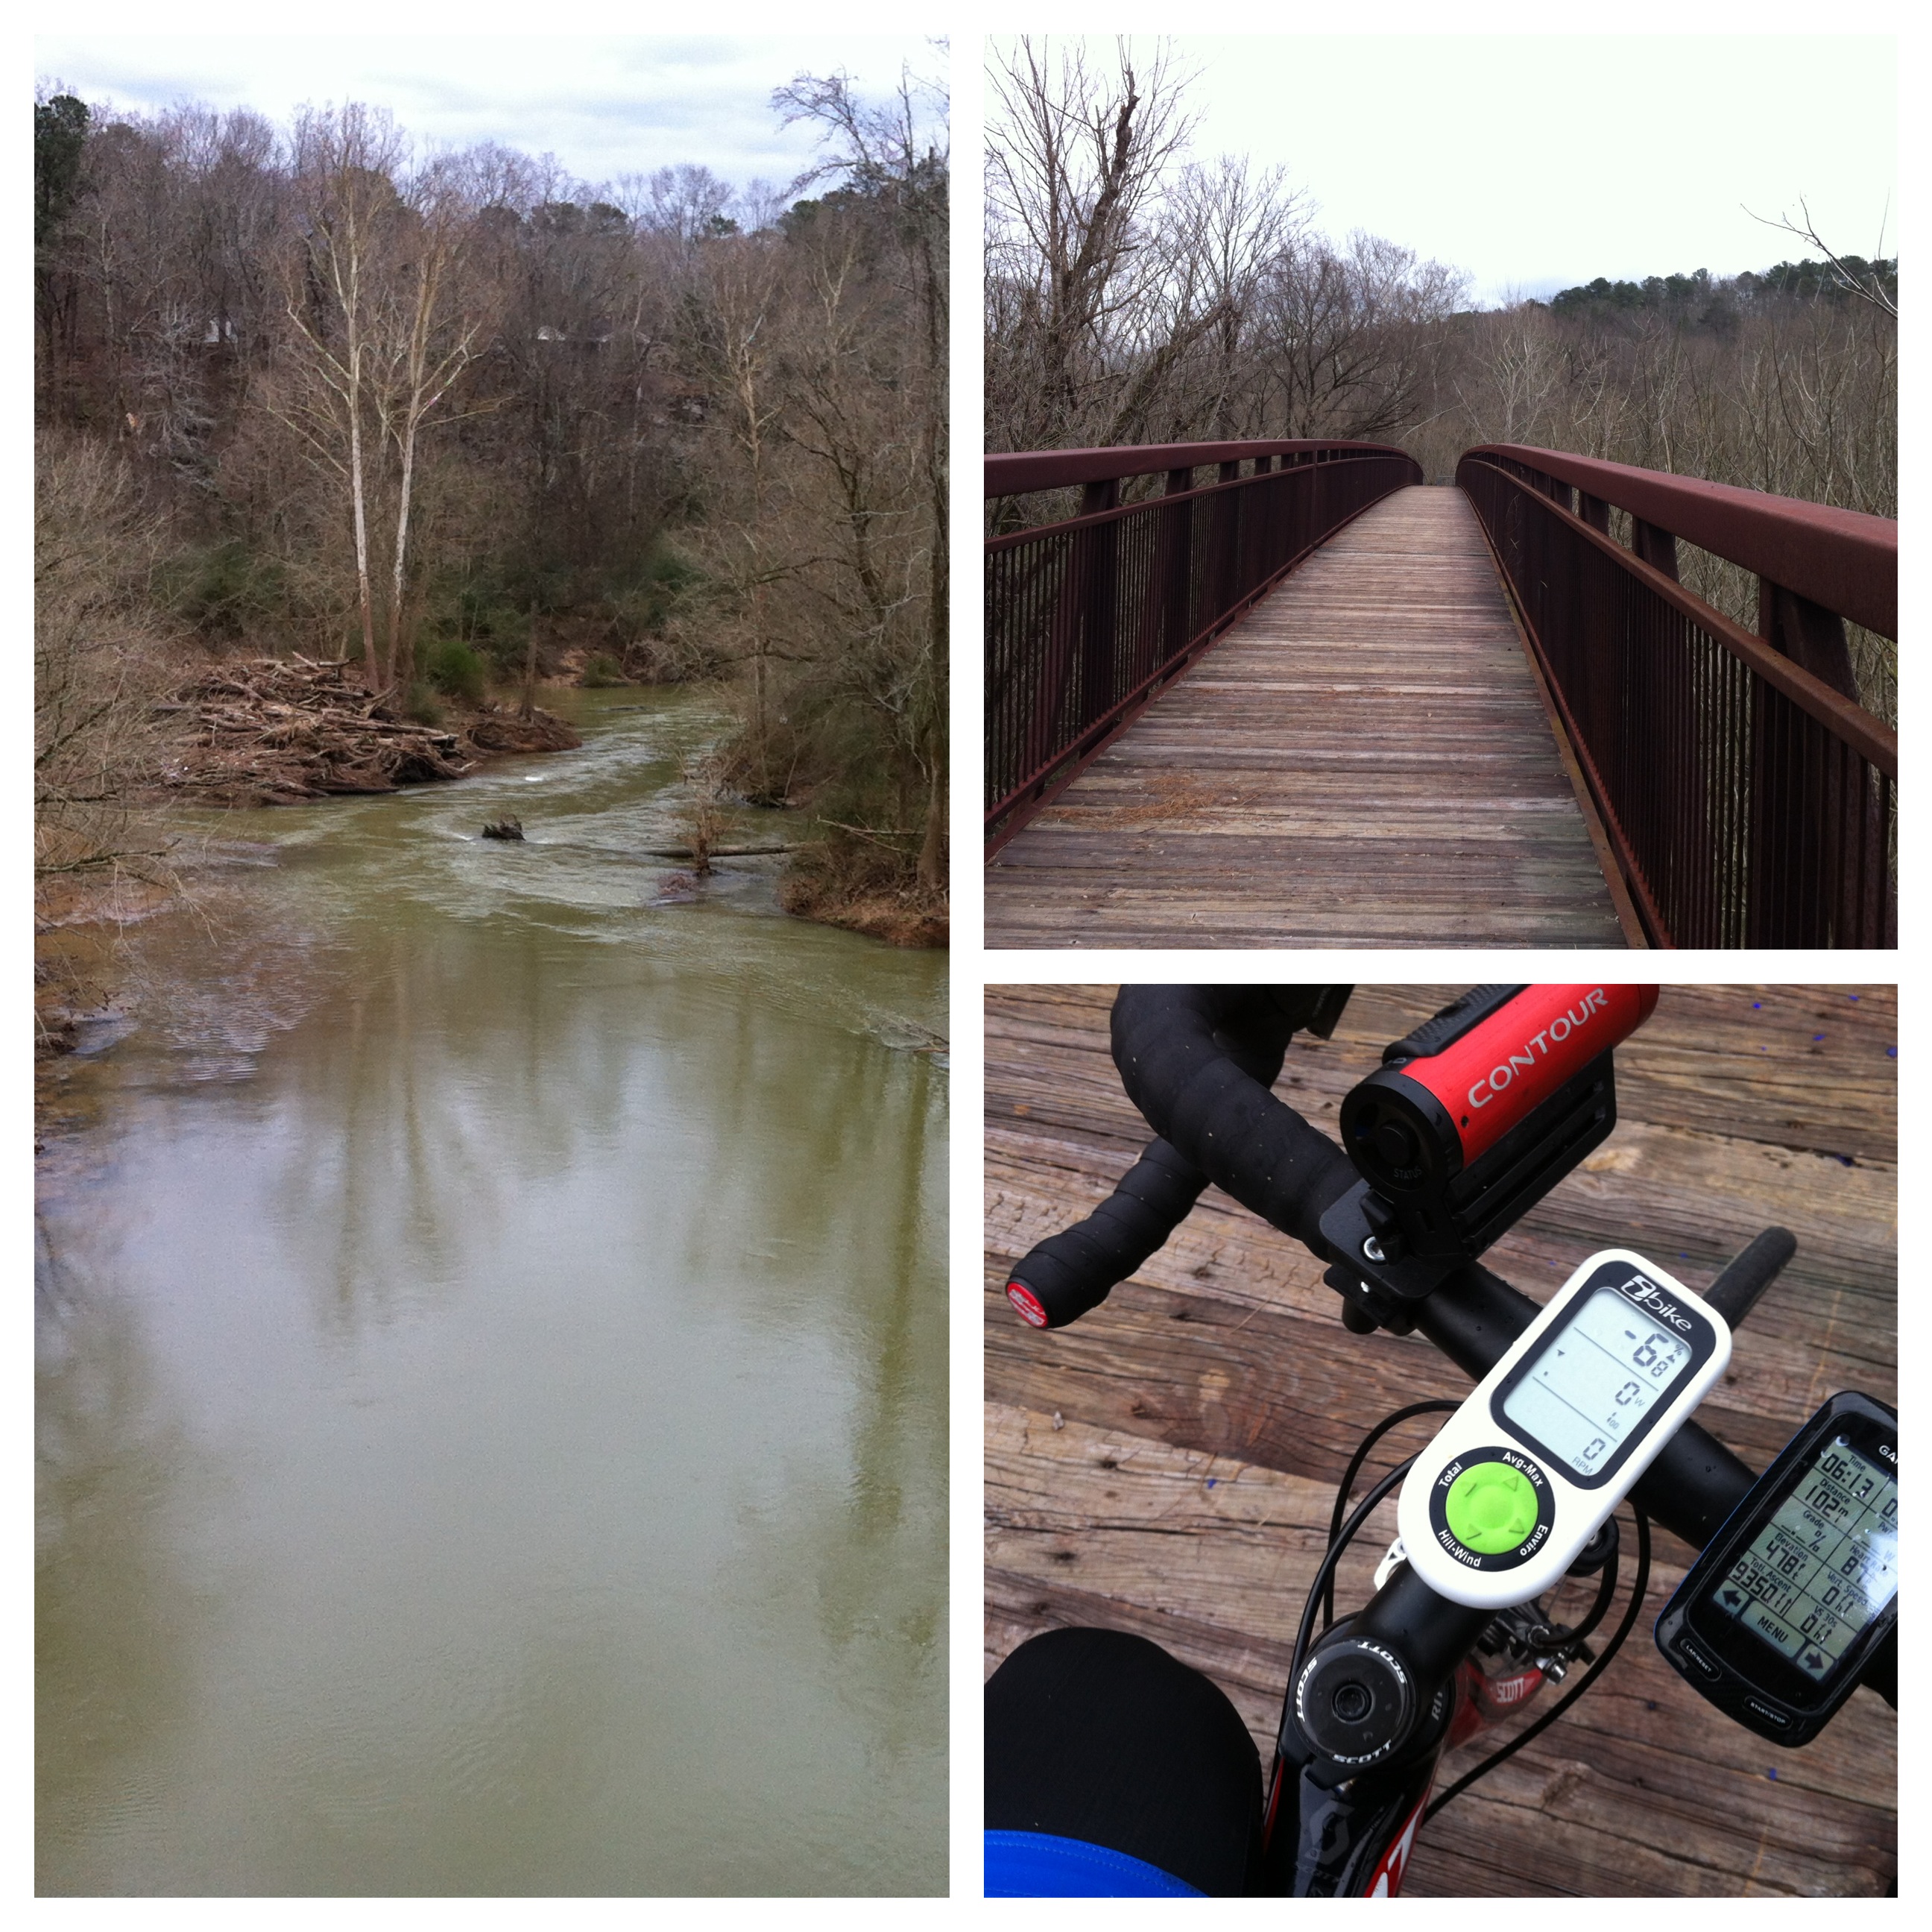
 Baseball skills assessment collage … Josiah was scheduled for his tryouts at 2:45 … I rode 102 miles and arrived at exactly 2:42, but he had gone early because it was starting to rain. Fortunately I was able to catch them in the parking lot before they left.
Yesterday my new iBike Newton+ arrived, and so I ran through the basic setup to get up and running for today’s BBL ride. I still need to do my on-the-bike calibration ride, but looking at the numbers both during the ride and afterwards – the iBike Newton+ seems to be delivering pretty reliable power numbers even without that extra calibration step. We had a small turnout for BBL with a number of riders out for a variety of reasons — including the cylocross world championships up in Louisville, Kentucky. Still, we had a great time on the Kelly Creek – Tunnel – Wall – Mountain Top loop.
Once I get my Quarq fixed by SRAM I’ll be able to explore some of the more “wind tunnel” advanced features of the Newton. In the meantime, I’ve made a video and highlighted the data for each of today’s attack zones organized as follows – video first, attack zone data next, and attack zone graph last. I did this for all three attack zones / KOMs which I happened to take a clean sweep of today!
STERRETT ATTACK ZONE (1st place)
Dist:        2.77 mi (0:06:57)
Energy:     138.1 kJ
Cals Burn:  132.1 kcal
Climbing:     186 ft
Braking:      0.0 kJ (0.0%)
          Min   Avg    Max
Power       0  331.3  1049  W
Aero        0  264.9   774  W
Rolling    27   45.7    66  W
Gravity  -657    1.3   482  W
Speed    14.2   24.0  34.5  mi/h
Wind     13.5   23.2  37.1  mi/h
Elev      448    499   571  ft
Slope    -6.4   0.02   9.1  %
Caden      33   85.7   111  rpm
HR        139  162.4   184  bpm
NP:379W IF:1.28 TSS:19 VI:1.15
CdA: 0.328 m^2; Crr: 0.0057
168 lbs; 2/2/2013 11:20 AM
43 degF; 1061 mbar
 iBike graph for the sterrett attack zone (click to enlarge)
VANDIVER KOM (1st place)
Dist:        1.79 mi (0:07:21)
Energy:     152.3 kJ
Cals Burn:  145.6 kcal
Climbing:     498 ft
Braking:      0.0 kJ (0.0%)
          Min   Avg    Max
Power     180  345.4   642  W
Aero        0   58.2   211  W
Rolling    18   27.9    43  W
Gravity    25  253.2   387  W
Speed     9.5   14.7  22.4  mi/h
Wind      4.4   14.1  23.2  mi/h
Elev      565    822  1064  ft
Slope     0.4   5.18  11.8  %
Caden      60   76.9   100  rpm
HR        141  170.8   180  bpm
NP:352W IF:1.19 TSS:17 VI:1.02
CdA: 0.328 m^2; Crr: 0.0057
168 lbs; 2/2/2013 11:45 AM
45 degF; 1060 mbar
 iBike graph for the Vandiver KOM (click to enlarge)
MIMOSA ATTACK ZONE (1st place)
Dist:        2.32 mi (0:06:07)
Energy:     135.6 kJ
Cals Burn:  129.7 kcal
Climbing:     241 ft
Braking:      0.0 kJ (0.0%)
          Min   Avg    Max
Power       0  369.5   957  W
Aero        0  236.7   851  W
Rolling    20   43.5    75  W
Gravity -1043   60.9   768  W
Speed    10.8   22.8  39.4  mi/h
Wind      0.0   21.2  37.9  mi/h
Elev      607    669   748  ft
Slope    -9.5   0.80  14.6  %
Caden      57   82.0   104  rpm
HR        122  165.6   181  bpm
NP:406W IF:1.37 TSS:19 VI:1.10
CdA: 0.328 m^2; Crr: 0.0057
168 lbs; 2/2/2013 12:08 PM
48 degF; 1059 mbar
 iBike graph for the Mimosa attack zone – annotated (click to enlarge)
COMPLETE RIDE
Dist:      104.76 mi (5:51:38)
Energy:    4063.1 kJ
Cals Burn: 3884.5 kcal
Climbing:    8491 ft
Braking:   -226.0 kJ (-5.6%)
          Min   Avg    Max
Power       0  192.6  1049  W
Aero        0  130.8  2294  W
Rolling     0   34.1    93  W
Gravity -2481    1.5   778  W
Speed     0.0   17.9  48.8  mi/h
Wind      0.0   16.1  52.5  mi/h
Elev      408    706  1107  ft
Slope   -19.9   0.02  18.9  %
Caden       0   81.8   130  rpm
HR         68  133.6   185  bpm
NP:247W IF:0.84 TSS:409 VI:1.28
CdA: 0.328 m^2; Crr: 0.0057
168 lbs; 2/2/2013 8:28 AM
44 degF; 1063 mbar
Leave a Reply