Tag: data
-

Canadian American data adventure – Part 2: the American Rockies
This blog tells the Idaho, Montana and Wyoming story of my 3757 mile data adventure riding home from Edmonton, Canada to my house in Hoover, Alabama while collecting videos, speeds and lateral passing distances for nearly 15,000 cars. The image above, similar to the first post (covering Days 1-4), is not my favorite – but…
-

A Canadian-American Data Adventure
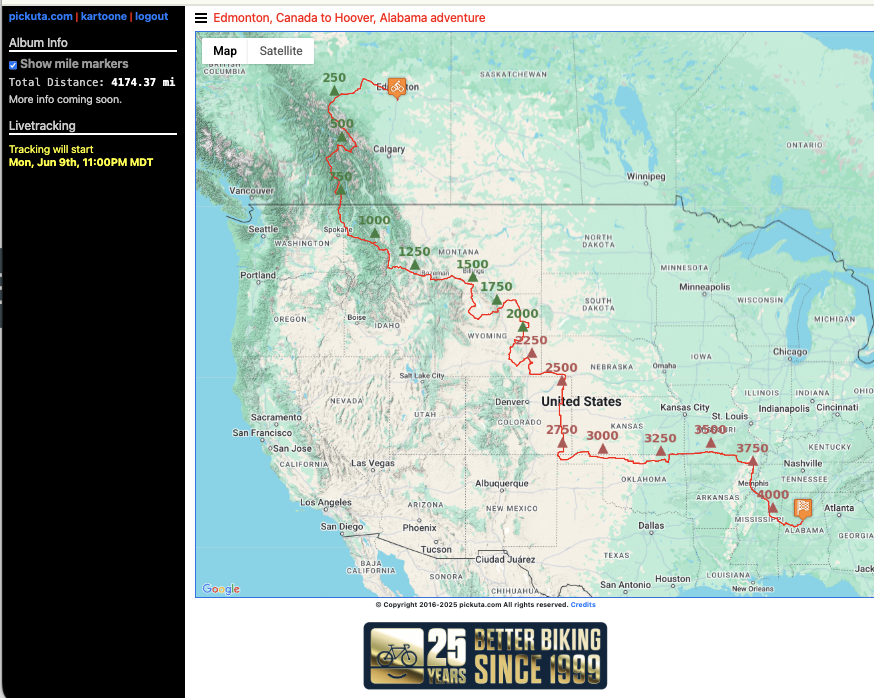
Tomorrow is the big day! The featured post image above is a map of my 4,173 mile route from Edmonton, Canada to Hoover, Alabama riding in two Canadian provinces, and 14 American states. The goal is 1) adventure and 2) data … so I am calling this my Canadian-American Data Adventure. I am raising funds…
-

TNGA 2021 – plus year-to-year comparison
This was my fourth year completing the TNGA. The first two years were part of the grand depart, and the second two years were as ITTs either earlier in the summer (2020) or a few days after the grand depart (2021). I’ve made a few tables below to compare the TNGAs and will build upon…
-
Skyway Epic and Tour de Tuscaloosa Double Header
Skyway 2016 100 mile podium. Left-to-right: Jeff Clayton, Brian Toone, and Hefin Jones. I was freezing cold after the race so I donned a skull cap and my winter jacket thinking I’d take it off right before the podium but then my zipper was stuck and I couldn’t get the jacket off. Oh well!!! Shout…
-
Paris-Brest-Paris southern style data analysis
One of the lessons that I learned the hard way during RAAM is that it really doesn’t matter how much power you can put out on the bike. It doesn’t matter how long you can sustain a Zone 5 heartrate. It doesn’t even matter a great deal how fast you ride your bike. The only…
-
24 hour mountain bike nationals – data and details
My adventure out west to race 24 hour mountain bike nationals led to a 7th place finish and lots of lessons learned for next year’s Race Across America. Here is all my heartrate data and a map annotating the course as well as a general description of the course. The lap times on my heartrate…
-
Catching up on some epic adventures
Life has been busy and is about to get busier, but I’ve had some pretty crazy adventures I wanted to blog about. These are ordered below based on when they happened, so you can jump to any specific one with these links: American Flyers | Just a little commute | Grant ups and downs March…
-
Tour de Tuscaloosa Power Data
First, before the power data – here’s a video that my wife got of the Pro/1/2 criterium finish Saturday night where I got 5th in the race, 4th in the field sprint. And now for the data – first the summary data, splits, and HR/Power graph for the criterium and the road race. 2012 Tour…