One of the lessons that I learned the hard way during RAAM is that it really doesn’t matter how much power you can put out on the bike. It doesn’t matter how long you can sustain a Zone 5 heartrate. It doesn’t even matter a great deal how fast you ride your bike. The only questions that matter are how long can you stay on the bike and how short can you make your stops? So the first data I wanted to look at from my 756 mile ride to Clemson and back over the weekend is my stoppage time. Here’s a quick summary of stats:
| Total distance | 755.8 miles (1/4 of RAAM) |
| Total climbing | 57,834 feet (Over 1/3rd of RAAM) |
| Elapsed time | 70h, 37min (2 days 22h, 37 min) 10.7 mph |
| Moving time | 52h, 01min (2 days 4h, 1 min) 14.5 mph |
| Total stoppage | 18h, 36 min |
| Total stoppage not including hotel | 9h, 9 min |
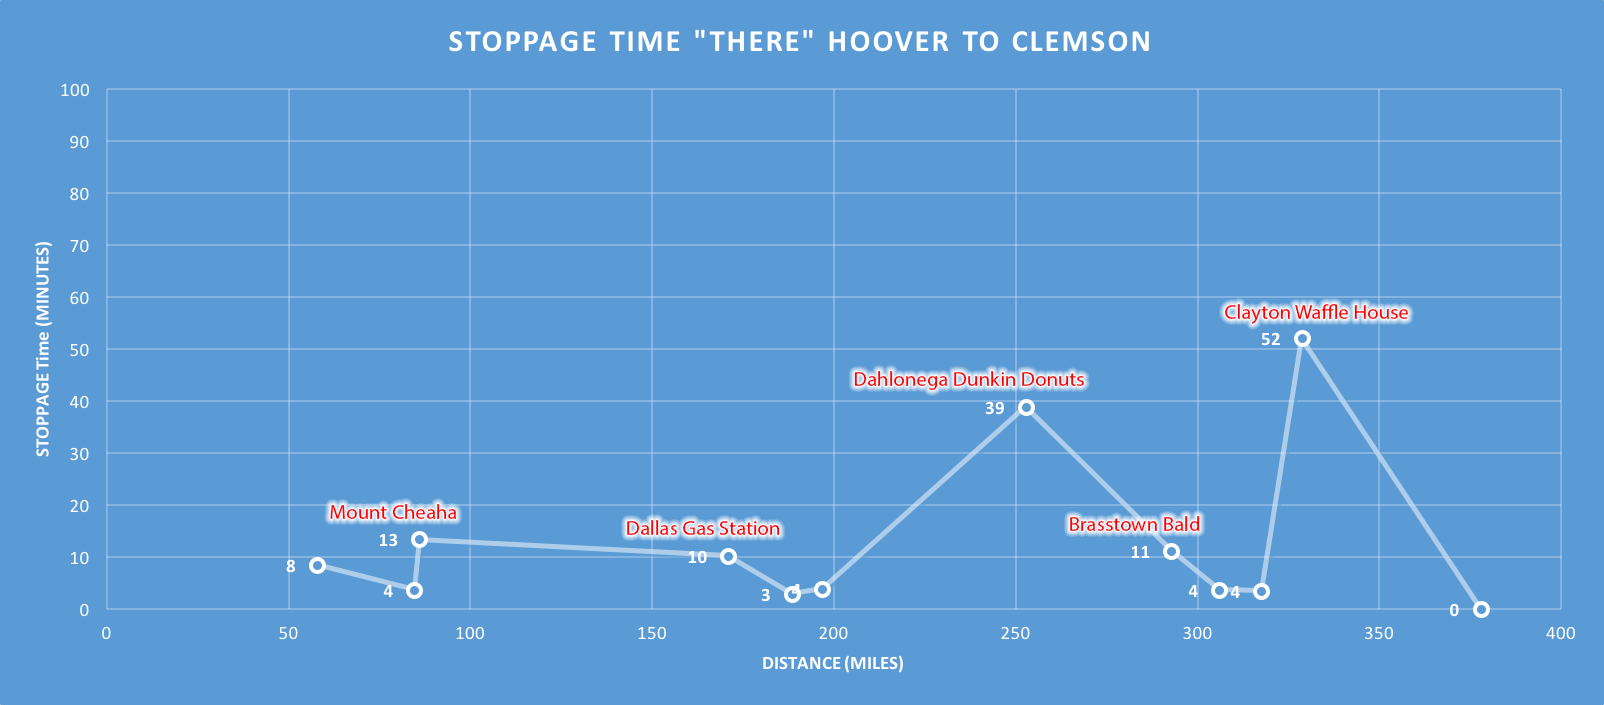 Annotated view of my stops on the way to Clemson. Click to enlarge and see detail.
Stops on the way to Clemson:
| Stop | Distance | Stoppage | Elapsed Time | Time of Day |
|---|---|---|---|---|
| Shocco Springs (clothes) | 57.8 | 0:08:28 | 3:36:00 | 3/25/16 22:09 |
| Cheaha Tower (photos) | 84.6 | 0:03:42 | 5:46:30 | 3/26/16 0:19 |
| Cheaha Vending Machine (clothes) | 85.9 | 0:13:23 | 6:02:00 | 3/26/16 0:35 |
| Dallas Gas Station (food) | 170.8 | 0:10:11 | 11:27:48 | 3/26/16 6:00 |
| Kennesaw Columns (clothes) | 188.4 | 0:02:53 | 12:42:53 | 3/26/16 7:15 |
| Canton Rd Gas Station (food) | 196.8 | 0:03:54 | 13:17:14 | 3/26/16 7:50 |
| Dahlonega Dunkin Donuts (food) | 252.7 | 0:38:54 | 17:01:26 | 3/26/16 11:34 |
| Brasstown Bald (clothes) | 292.7 | 0:11:10 | 21:30:43 | 3/26/16 16:03 |
| US76-bottom of first climb (clothes) | 305.9 | 0:03:39 | 22:52:30 | 3/26/16 17:25 |
| US76-top of last climb (clothes) | 317.5 | 0:03:32 | 23:53:02 | 3/26/16 18:26 |
| Clayton Waffle House (food) | 328.6 | 0:52:04 | 24:41:25 | 3/26/16 19:14 |
| Clemson Holiday Inn Express (sleep) | 377.8 | – | 29:14:04 | 3/26/16 23:47 |
| Summary – 11 stops, Average distance between stops: 34.3 miles, Average time between stops: 2 hr, 40 min, Average stop duration: 17min, 44sec. Notes: it rained a bit in North Georgia, but it was dry for all of Alabama and South Carolina and most of Georgia. There was still some pretty big temperature swings, hence all the clothing stops – especially Brasstown Bald and US-76 where it went from hot and dry to raining and cold twice in short succession. | ||||
 Annotated view of my stops on the way back home from Clemson. Click to enlarge and see detail.
Stops on the way back home to Alabama:
| Stop | Distance | Stoppage | Elapsed Time | Time of Day |
|---|---|---|---|---|
| Gravel road currahee (clothing) | 51.3 | 0:03:34 | 3:22:14 | 3/27/16 12:35 |
| Dunagan Chapel (rain-clothing) | 83.7 | 0:05:26 | 5:36:25 | 3/27/16 14:49 |
| Rabittown Café (food) | 88 | 0:18:28 | 6:01:03 | 3/27/16 15:14 |
| Old Alabama Rd (clothing) | 135 | 0:02:37 | 9:22:00 | 3/27/16 18:35 |
| Vinings Starbucks (food) | 154.4 | 1:27:12 | 10:44:15 | 3/27/16 19:57 |
| Silver Comet (clothing) | 160.6 | 0:04:43 | 12:36:10 | 3/27/16 21:49 |
| Cedartown Waffle House (food) | 209.9 | 0:38:49 | 15:56:52 | 3/28/16 1:09 |
| Alabama State Line (photos) | 220.5 | 0:04:30 | 17:20:24 | 3/28/16 2:33 |
| Chief Ladiga (rain-clothing) | 229.4 | 0:02:37 | 17:54:50 | 3/28/16 3:07 |
| Chief Ladiga trail tree down (obstacle) | 230.7 | 0:04:54 | 18:02:12 | 3/28/16 3:15 |
| Fort McCllelan (charging-lights) | 258 | 0:03:25 | 20:07:59 | 3/28/16 5:20 |
| Fort McCllelan (charging-lights again) | 259.7 | 0:03:25 | 20:22:16 | 3/28/16 5:35 |
| Oxford McDonalds (food) | 264.4 | 1:05:29 | 20:43:56 | 3/28/16 5:56 |
| Hanging Rock Rd (clothing) | 296.8 | 0:02:21 | 24:30:59 | 3/28/16 9:43 |
| Talladega Walmart and McDonalds (charging) | 311 | 0:41:46 | 25:38:00 | 3/28/16 10:51 |
| US231 Kelly Creek (charging) | 334 | 0:01:43 | 27:50:33 | 3/28/16 13:03 |
| Chelsea Chevron (food/charging) | 350.3 | 0:22:56 | 29:02:57 | 3/28/16 14:15 |
| Double Oak Cliffs (photos) | 361.2 | 0:02:20 | 30:27:43 | 3/28/16 15:40 |
| 280 Starbucks (food) | 367.5 | 0:07:24 | 30:56:52 | 3/28/16 16:09 |
| Home | 378 | – | 31:57:19 | 3/28/16 17:10 |
| Summary – 19 stops, Average distance between stops: 19.9 miles, Average time between stops: 1 hr, 41 min, Average stop duration: 18min, 42sec. Notes: it rained quite a bit in Georgia and Alabama so I had to stop a bunch for clothing, covering Garmins, etc… Also, I had some major charging / battery problems pretty much the whole ride so any stop labeled “charging” is a stop I didn’t want to make, but was forced to make in order to plug devices into wall outlets. Also, the Vinings Starbucks stop and the Cedartown Waffle House stop were both longer than I wanted to stop but I had to wait for devices to charge. | ||||
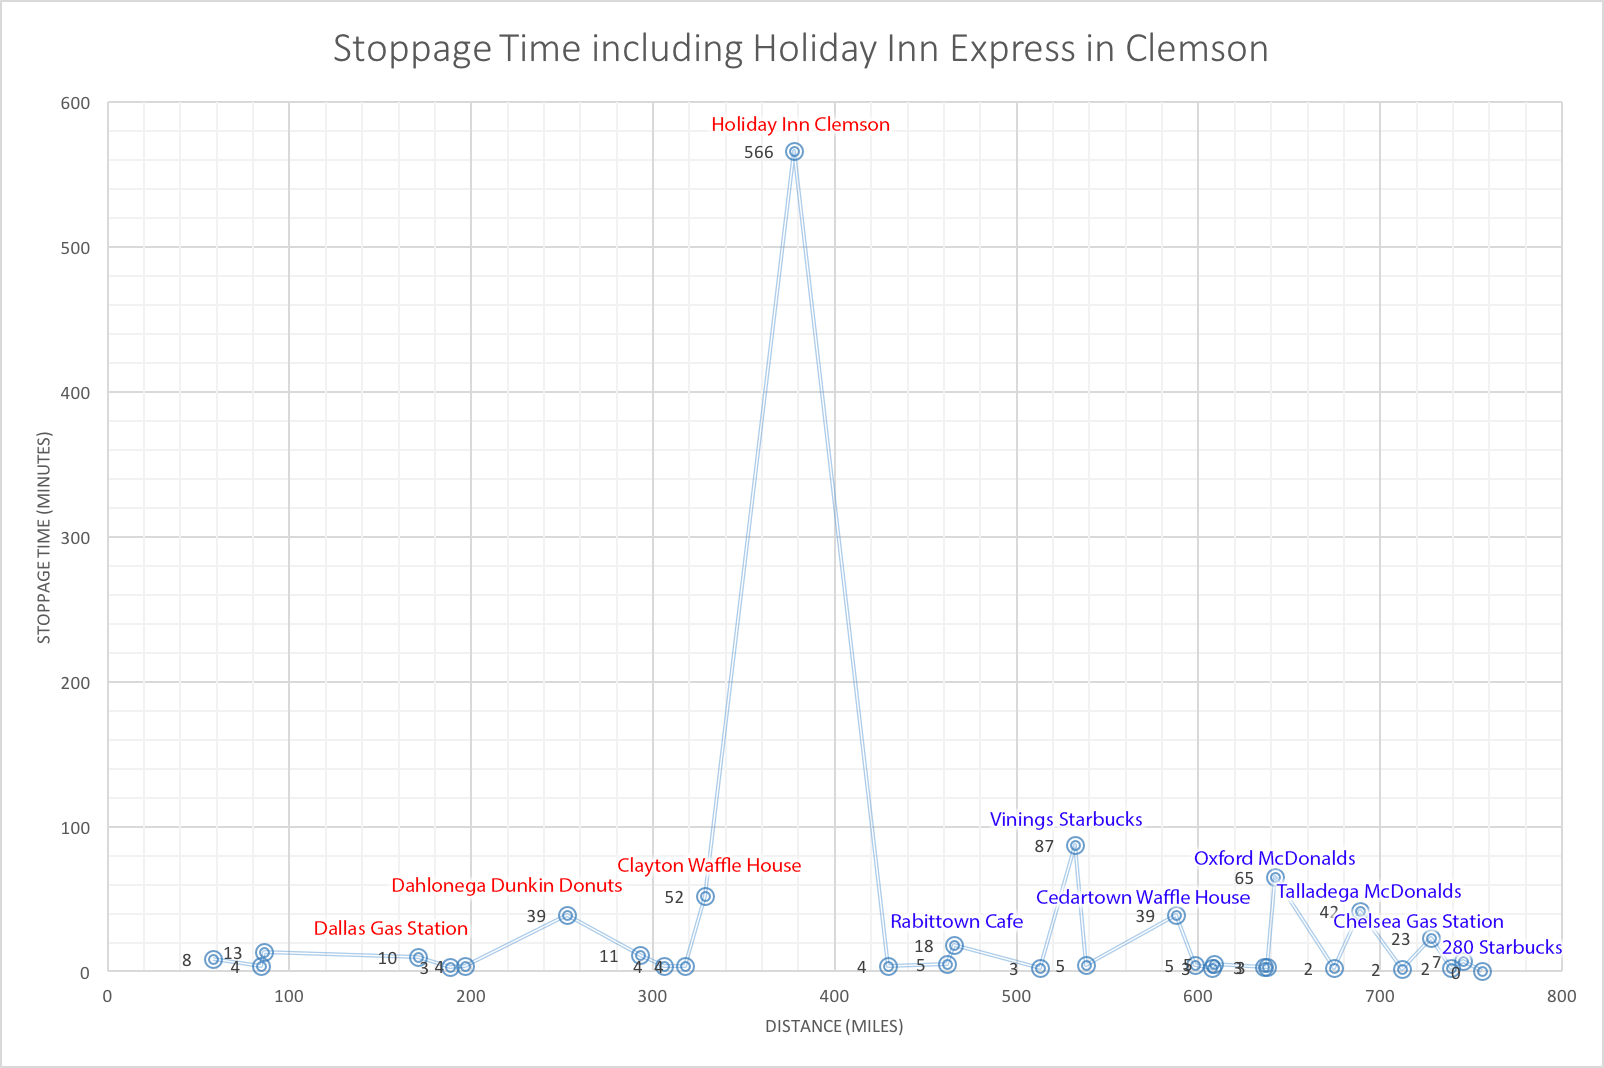 Annotated stops round trip including my 9.5 hour stop at the Holiday Inn Express in Clemson. Click to enlarge and see detail.
In RAAM, of course, sleep stops also count against your time. So including my sleep stop in Clemson, here is the overall stop data.
| # stops: | 31 |
| avg stop duration: | 36 minutes |
| dist b/t stops: | 24.4 miles |
| time b/t stops: | 2 hours, 16 minutes |
Even my stop in Clemson was longer than I wanted it to be. I only slept for 7 hours, but I was stopped for 2.5 hours longer than that mainly so I could charge lights, di2, and garmins before leaving since I had only charged my powerbanks overnight. So it’s a little unfair to compare to RAAM, but in RAAM I only averaged 17.6 miles between stops so 24.4 miles is quite an improvement and would have been even better if I hadn’t had the extra stops on the second day trying to keep my devices charged. There was also another major improvement for this ride: cadence!
Cycling Data
This was quite the adventure with tons of climbing. I was really wanting to do a side-by-side comparison of Cheaha, Brasstown, and Sassafras on the same ride — but that will have to wait until next time!
| Total distance | 755.8 miles (25% of RAAM) |
| Total climbing | 57,834 feet (36% af RAAM) |
| Overall average speed (elapsed) | 10.7 mph |
| Overall average speed (moving) | 14.5 mph |
| Overall power average | 143 watts |
| Overall heartrate average | 109 bpm |
| Overall cadence average | 74 rpm |
| Day | Power | HR | RPM | MPH | Climbing | Distance |
|---|---|---|---|---|---|---|
| Day 1 | 159 w | 116 | 75 | 14.57 | 33,717 ft | 377.8 mi |
| Day 2 | 127 w | 102 | 74 | 14.55 | 24,117 ft | 378.0 mi |
Shifting Data
It was easy to see the impact of having a 32 tooth rear cassette on my overall shifting data – mainly, my average cadence went up quite a bit compared to RAAM. Also, I was consciously trying to spin an easier gear all the time to help avoid smashing the bottoms of my feet by mashing too big of a gear. One of the ways that I would do that is when I got to the bottom of a hill I would shift into easier and easier gears while still in the big chainring so that there would be a bigger jump when I switched down to the low chainring. I would still switch to the small chainring at what I perceived was my “normal” time so that meant I would be spinning a really high cadence into the bottom of the hill. Then I would move up into easier gears as necessary. Because of this, there was a lot 53×18, 39×18 transitions on day 1 and 53×20, 39×20 transitions on day 2. This really helped as my feet were pretty much shot by 1/4 of the way through RAAM. This ride, which was also 1/4 of RAAM saw my feet get not nearly as sore as RAAM – and that is even with a 1.2 mile hike up/down on Brasstown in my speedplay shoes, which killed my feet at the time. But because of spinning the easier gears, my feet were able to recover some and felt better by the end of the ride. Shift data and shift map below!

 Shift map for my ride from Hoover to Clemson via Cheaha and Brasstown. Click to see an interactive version.
 Shift map for my ride back home from Clemson via Cheaha. Click for an interactive version.
Leave a Reply