Today was a really hard ride … no racing this weekend (sadly) since the Barbers race was cancelled this year. So I did a bit of race simulation by picking out the longest climb in the Birmingham area (Pumphouse – Vestavia Dr) and trying to take back the KOM on it. I also picked out two other climbs to hit hard – one before the Pumphouse climb and one after it. The Vestavia Falls to Vestavia Lake overlook climb came shortly after the Pumphouse climb. I had gone hard enough on the Pumphouse Climb to be hyperventilating across the top down to chester and then nearly fall over climbing up chester so I had only barely pulled it together by the time I hit the Vestavia Falls climb. By the top of this third KOM effort for the day, I had so little upper body strength left from pulling on the bars that I felt something was wrong with my wheels/tires because any bump or small gust of wind would knock me a little sideways. I realized later that it was because I had nothing left in the muscles to compensate for the normal riding conditions. Thankfully this only lasted a short ways back down the descent. Still, I was somewhat shell-shocked from the back-to-back efforts, and it wasn’t until I had made it over closer to Bluff Park that I was starting to feel normal again. The rest of the ride was at a much harder than normal tempo to try to minimize total ride time given that today is my wife’s birthday, and we were heading out to the cheesecake factory for a late birthday lunch.
Here are the iBike stats on the KOMs I set today (in order) –
---------Caldwell Mill to Abingdon Abandoned House ---------
Dist:        0.78 mi (0:03:33)
Energy:      78.9 kJ
Cals Burn:   75.4 kcal
Climbing:     288 ft (Strava cat 4)
Braking:      0.0 kJ (0.0%)
          Min   Avg    Max
Power     204  370.5   562  W
Aero        0   39.2   191  W
Rolling    10   17.1    28  W
Gravity    -2  298.7   520  W
Speed     7.9   13.2  21.5  mi/h
Wind      0.0    8.4  22.2  mi/h
Elev      291    433   560  ft
Slope    -0.0   6.79  15.6  %
Caden      55   73.7    92  rpm
HR        106  161.2   173  bpm
NP:371W IF:1.34 TSS:11 VI:1.00
CdA: 0.342 m^2; Crr: 0.0039
168 lbs; 4/7/2012 11:05 AM
71 degF; 1013 mbar
---------Pumphouse - Vestavia Dr ---------
Dist:        4.85 mi (0:16:22)
Energy:     335.2 kJ
Cals Burn:  320.4 kcal
Climbing:     864 ft (Strava cat 3)
Braking:    -15.5 kJ (-4.6%)
          Min   Avg    Max
Power       0  341.3   678  W
Aero        0  127.6   900  W
Rolling     0   23.0    43  W
Gravity  -971  163.4   667  W
Speed     0.0   17.8  33.2  mi/h
Wind      0.0   16.3  41.1  mi/h
Elev      157    468   853  ft
Slope    -8.8   2.75  14.8  %
Caden      16   77.9   107  rpm
HR        126  171.6   193  bpm
NP:363W IF:1.31 TSS:47 VI:1.06
CdA: 0.342 m^2; Crr: 0.0039
168 lbs; 4/7/2012 11:32 AM
75 degF; 1013 mbar
---------Vestavia Fall to Vestavia Lake overlook ---------
Dist:        0.75 mi (0:03:17)
Energy:      73.2 kJ
Cals Burn:   70.0 kcal
Climbing:     274 ft (Strava cat 4)
Braking:      0.0 kJ (0.0%)
          Min   Avg    Max
Power       0  371.6   675  W
Aero        0   35.8   321  W
Rolling    12   17.7    32  W
Gravity   -89  317.4   693  W
Speed     9.3   13.7  24.4  mi/h
Wind      0.0   10.6  27.2  mi/h
Elev      416    562   684  ft
Slope    -2.5   6.96  14.8  %
Caden       8   70.6    95  rpm
HR        122  170.1   180  bpm
NP:392W IF:1.41 TSS:11 VI:1.05
CdA: 0.342 m^2; Crr: 0.0039
168 lbs; 4/7/2012 12:07 PM
76 degF; 1013 mbar
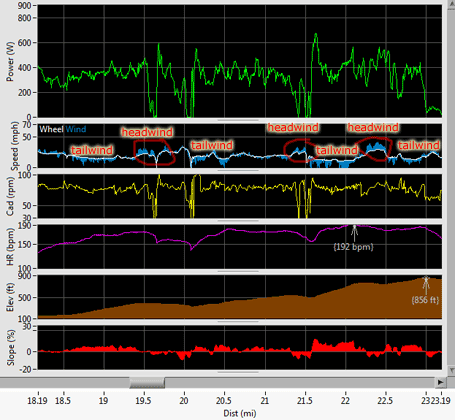
The pumphouse climb is the longest climb in the immediate Birmingham area (that I know of). It is just over 4.5 miles long with nearly 750ft of vertical diff from the low point near the Cahaba River to the highest point on the Shades Mountain ridge on Vestavia Dr. There are also two stop lights, three stop signs, and three downhills on the climb so the total elevation gain is well over 850ft. What was really interesting today is that there was a steady, firm breeze blowing from the west and yet I had a tailwind on most of the pumphouse climb which should have been straight into the headwind. The deep valleys in Birmingham sometimes get colder in the mornings than the top of the ridge lines. Then during mid to late morning and even early afternoon, you get an updraft on the hills as the air warms in the valleys and rises. Note in the iBike screenshot below zoomed into the pumphouse climb that there is a headwind on the flats and downhills and a tailwind on the uphills. This wasn’t just erroneous wind readings on the ibike, it was really obvious when you were hitting the headwind and when you had the tailwind.
 pumphouse climb annotated map with wind direction
 ibike graph for pumphouse climb – annotated
 ibike data for the complete ride (click to enlarge)
Finally, here is a fun easter picture I got of the kids right after I got back from my ride … happy easter everyone!
 THREE easter bunnies
And here annotated garmin screenshots from the ride:
Leave a Reply