First, before the power data – here’s a video that my wife got of the Pro/1/2 criterium finish Saturday night where I got 5th in the race, 4th in the field sprint.
And now for the data – first the summary data, splits, and HR/Power graph for the criterium and the road race.
2012 Tour de Tuscaloosa Criterium Pro/1/2 lap splits
				Power
Lap	Time	Miles	Avg	xPow	Max	HR	MPH
1	2:58	1.2	245	259	871	155	25.2
2	2:53	1.2	291	286	879	164	25.7
3	2:41	1.2	353	385	996	176	27.8
4	2:53	1.3	324	331	821	180	26
5	2:59	1.3	305	313	997	175	25.2
6	2:47	1.3	223	229	814	167	27
7	2:45	1.2	284	303	941	174	27.4
8	2:54	1.2	274	285	840	170	25.7
9	2:50	1.2	269	294	856	174	26.2
10	2:53	1.3	282	310	932	172	26.1
11	2:56	1.2	310	382	877	175	25.5
12	3:01	1.2	267	288	831	177	24.8
13	3:04	1.2	208	221	720	160	24.3
14	2:54	1.2	218	233	736	159	25.6
15	2:58	1.2	232	229	727	163	25.2
16	2:48	1.2	262	271	790	170	26.5
17	2:57	1.3	248	254	920	167	25.5
18	2:36	1.2	353	352	925	179	28.8
Total	52:01	22.5	274	312	997	170	26
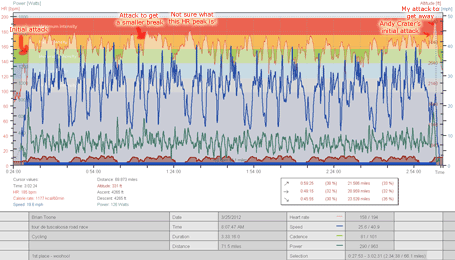
 Annotated heartrate and power data from Saturday’s Pro/1/2 criterium (click to enlarge)
2012 Tour de Tuscaloosa Road Race Pro/1/2 lap splits
				Power
Lap	Time	Miles	Avg	xPow	Max	HR	MPH
1	22:04	9.6	274	305	963	161	26.1
2	21:41	9.6	262	281	801	157	26.6
3	21:45	9.6	292	310	808	166	26.5
4	22:35	9.6	254	273	641	155	25.6
5	23:17	9.6	257	276	604	153	24.8
6	23:28	9.6	254	268	697	152	24.5
7	18:41	8.0	313	332	950	166	25.8
Total	2:34:57	66.1	270	295	963	158	25.6
 Annotated heartrate and power data for the road race (click to enlarge)
Now for the detailed data graphs and plots … first the critical power curves for both the criterium and the road race. I tied one power record in the criterium, and I set three new personal power records for the road race as indicated on the graphs.
 Pro/1/2 criterium critical power curve (click to enlarge)
 Pro/1/2 road race critical power curve (click to enlarge)
Here are the pedal force / pedal velocity graphs which highlight the different amount of force being applied to the pedals at different cadences.
 Pro/1/2 criterium pedal force vs pedal velocity (click to enlarge)
 Pro/1/2 road race pedal force vs pedal velocity (click to enlarge)
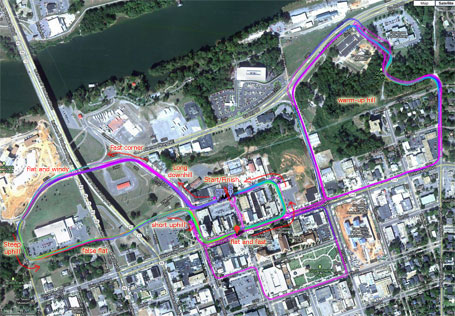
And finally here are the power maps for the two courses:
 Pro/1/2 criterium power map (click to enlarge)
 Pro/1/2 road race power map (click to enlarge)
Leave a Reply