First, a huge thank you to everyone in the cycling community and to all who have been following my racing this year. I’ll expand this thank you at the end of the post, but I wanted to thank everyone up front first.
These statistics all run from November 1, 2010 until October 30, 2011 – 364 days worth of riding and racing. This is a deviation from previous years where I have calculated statistics for what I would call my racing/training season – from December 1st of the previous year until the weekend ending close to October 15th of the current year. This strategy is somewhat less than precise and completely ignores the “off season” where I am still riding, commuting etc… So from here on out, I’m just going to stick with a full calendar year (ending on the nearest weekend, in this case October 30th) for tracking all of the stats. The Polar Protrainer software makes it easy to re-calculate these statistics over new date ranges.
Statistics Summary
November 1, 2010 – October 30, 2011
| Statistic | Avg | Max | Min | Total |
|---|---|---|---|---|
| Weekly training time (hours) | 22.43 | 32.95 | 9.57 | 1166.7 |
| Weekly distance (miles) | 338.4 | 502.7 | 140.3 | 17,597 |
| Workouts per week (#) | 11 | 17 | 4 | 580 |
| Weekly climbing (feet) | 30,738 | 52,188 | 6,821 | 1,598,333 |
For eagle-eyed observers who note that the climbing total is lower than that reported on Strava, the reason is because I am generating these reports from my Polar Protrainer software. I wrote a converter that converts Garmin .FIT files and .TCX files into the .HRM format that Polar expects. The Polar Protrainer software then applies a smoothing filter when it is calculating total ascent and other statistics, but I can’t figure out how to turn it off so that the statistics match up with Strava, which doesn’t apply any smoothing filters.
Some weekly milestone totals (from Strava):
- 11 weeks with more than 400 miles of riding, including one 502 mile week
- 8 weeks with more than 50,000 ft of climbing, including one week with 58,000 ft
- 11 weeks with more than 25 hours of training/racing
Other statistical highlights (from Strava):
- Approximately 430 different KOMs on Strava
- An end of the season 163 mile epic with over 17,000 ft of climbing
- A new max speed of 61.5 mph on the Sassasfras Chimneytop Descent
The mileage and climbing represent a substantial increase from previous years, but my heartrate average dropped by 5bpm per ride on average which is a substantial decrease in intensity. The extra easy miles mixed in with bouts of intensity from racing and Strava KOM attempts combined with “SportLegs” and wearing compression clothing nearly 100% of the time that I am not on the bike or sleeping has been the perfect formula to keep from overtraining.
Comparison to past years
All years run from the Monday closest to November 1st to the Sunday closest to October 31st. This should result in about 365 days for each year give or take a day or two.
| Statistic (per week) |
2008 Avg/Max |
2009 Avg/Max |
2010 Avg/Max |
2011 Avg/Max |
|---|---|---|---|---|
| Training (hours) | 14.0/20.2 | 13.4/20.8 | 15.4/20.9 | 22.4/33.0 |
| Distance (miles) | 238.4/337.1 | 241.8/369.4 | 265.5/380.3 | 338.4/502.7 |
| HR avg (bpm) | 137/165 | 139/161 | 136/176 | 131/178 |
| Workouts (#) | 11/15 | 9/14 | 11/14 | 11/17 |
| Climbing (feet) | 12.7k/20.3k | 13.5k/29.3k | 14.4k/22.8k | 30.7k/52.2k |
| Statistic (yearly total) |
2008 Total |
2009 Total |
2010 Total |
2011 Total |
|---|---|---|---|---|
| Training (hours) | 726 | 698 | 798 | 1,167 |
| Distance (miles) | 12.4k | 12.6k | 13.8k | 17.6k |
| Workouts (#) | 560 | 4451 | 546 | 580 |
| Climbing (feet) | 661k | 677k | 750k | 1,598k |
1 When I first got my Garmin in November 2008 (which falls in the 2009 year), I was leaving my commutes as one ride. In other words, I would just stop the timer while I was at work and then start it back up for the return trip home. During 2008, I was using a Polar HRM which wouldn’t let you do that so each commute was counted separately as a workout. Then at some point later in the 2009 season, I decided to just do separate workouts for each commute on my Garmin. So really, the only apples-to-apples comparison for the number of workouts is for the years 2008, 2010, and 2011.
Racing Season Summary
The 2011 season has definitely been my best ever, but there have been a few disappointments as well … so I think I’ll call this the season of “almosts”. Somehow I managed to have some of the best results of my racing career, and yet, each result was tinged with a little bit of disappointment about what might have been. For example, near the beginning of the season I won the Alabama State road race this year by being the first place Alabama rider across the line, but I narrowly missed out on winning the race outright in a two-up downhill sprint. Then, near the end of the season, I almost won an NRC race solo. After getting caught on the last lap by a chase group of three, I managed to get DFL in the sprint and miss out being on an NRC podium by exactly one spot. In the same weekend, I missed out on a top 10 in an NRC omnium by one spot – placing 11th. Don’t get me wrong, I am really, really happy with those results, but it is still a bit disappointing to come so close and still miss out. In the Six Gap Criterium, I almost won a $150 prime towards the end of the race after almost bridging to the winning break earlier in the race. In the Six Gap Century the next morning, Jimmy Schurman and I almost beat the course record – falling short by 1 minute. For the season, I have six 4th place finishes, five 2nd place finishes, and three 11th place finishes – the dreaded “almost” positions (i.e., almost on the podium, almost winning, and almost in the top 10).
One “almost” that I am very thankful for is how a crash in May turned out when it could have been much, much worse. On the next to last lap at the Sandy Springs criterium, I came into a corner too hot, over-corrected when my wheels started to slide out from under me, and ended up t-boning the metal barriers shoulder first at pretty much full speed (30+mph), and somehow came out of the wreck with only a torn pectoral muscle, separated shoulder, and broken toe. This was the first broken bone and major injury I’ve had on the bike in nearly 20 years of racing even having gone down in many different accidents throughout the years. Everything healed up great and three weeks later I was racing again.
Despite all of the “almosts”, there has been lots to be thankful for and to celebrate –
- Strava – motivation to climb more than I ever have before – should hit 2 MILLION feet by the end of the year and hopefully win a year-long worldwide competition. http://app.strava.com/komchallenge/men/2011 Fun to compete again people from all over the world, and there have been some close months that I have lost and yet it has still been really fun.
- Long multi-day races – I had the opportunity to race several multi-day omniums. Perhaps my favorite was the Tour of America’s Dairyland where I stayed with an amazing host family for 10 days of racing – culminating with a top 10 finish on the last day of racing in front of the Wisconsin state capital http://toonecycling.wordpress.com/2011/06/28/madison-criterium-tour-of-americas-dairyland-day-11/.
- Athens Twilight – I won a late race prime coming around the entire United Healthcare leadout train (although they weren’t going for the prime) and still finished in the top 30.
- Improved time-trialing – I have moved from the very bottom to somewhere roughly in the middle of the results sheet in time trials – including one time trial that was well-attended with strong riders where I almost won money. Yes, it was one of those 11th place “almost” positions where they paid 10 deep.
- Podium, baby! – Counting the Strava monthly competition, I have been on the podium 25 times this year!
Finally, the graphs and charts!
 2011 Critical Power. The red dashed line is the predicted power I should be able to sustain for the given time period. The solid colored area is the best I have ever attained for a given time period. The black line is the data from the Six Gap Century.
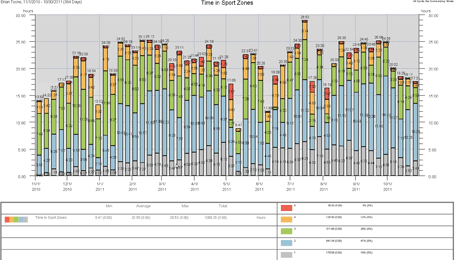
 Time spent in heartrate zones. This bar chart is the report that I look at most often throughout the year. I want to make sure at certain times of the year that I am spending enough time in the “red zone”, and at other times of the year I want to make sure I am not spending too much time in the red zone.
 Total training time. This graph is a display of my weekly total training time. Can you guess which week I crashed at Sandy Springs??? I still managed 9 hours that week riding with one of my arms in a sling!
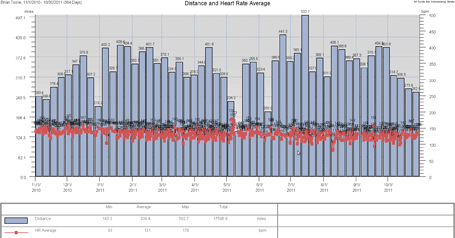
 Distance and heartrate average. This graph plots the weekly distance and the heartrate average for each individual ride for the entire year.
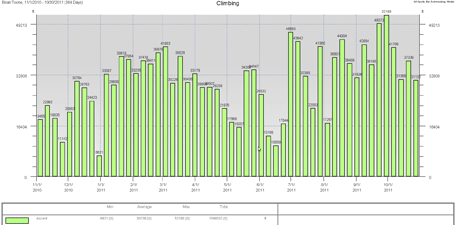
 Weekly climbing. This is my weekly climbing for the year (with Polar smoothing filter that can’t be turned off applied). Can you guess which week was spent up at the Tour of America’s Dairyland in Wisconsin?
 Number of workouts. Note the distinct drop in the summer when I am not commuting.
And finally, finally, some more thank you’s
I am deeply appreciative to so many people who make it possible for me to ride and race my bike as much as I do. First of all my @beautifulwife, Kristine Toone, and my kids Analise and Josiah, my parents and all of my teammates, friends, and family. I’m working on a separate post with a map of all the places that we have travelled and all the places where we have stayed for races. In that post, I’ll thank people by name who have helped out so much. I’ll leave this exceedingly long post with just one more thanks – thanks!
Leave a Reply