Jacob Tubbs sent me a link yesterday to a climb near Trento, Italy called the Scanuppia – Malga Palazzo which averages 17% for nearly 5 miles with maximum pitches of close to 45%. Yesterday, I went out to find the steepest climbs in Birmingham for comparison purposes. I think we will call it the Scanuppia factor – the maximum distance on a climb that averages 17%.
South Cove Dr – 0.26miles @ 17.4%
Woodcrest – 0.18 miles @ 17.2%
Southcrest – 0.22 miles (split into 3 segments, 18.2%, 17.1%, and 18.4%)
Montclair (Trinity) – 0.13 miles @ 17.8%
Elder St – 0.1miles @ 17%?
Stone River – 0.19 miles @ (17.5%, split into 2 segments)
Keep in mind that the real Scanuppia climb in Italy averages 17% for 7.5km (4.7 miles). So in other words, it is almost 20 times longer than the South Cove Dr climb!
![]() The “Scanuppia Factor” for the Birmingham Monsters.
The “Scanuppia Factor” for the Birmingham Monsters.
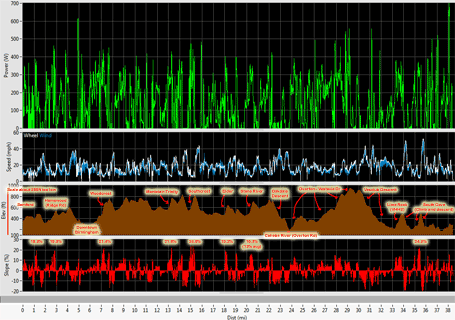
 The Birmingham Monsters – annotated iBike data for complete ride. One of my favorite things about this graph is how it looks like the Montclair (Trinity) climb is bending backwards at the top!
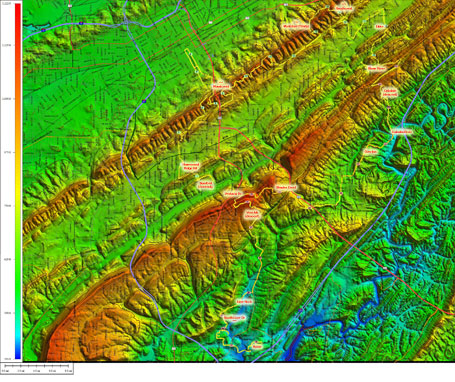
 TopoCreator map of the ride with climbs and descents annotated.
Also, you can view a detailed map of the ride on Strava
Here are the elevation profiles for the four monsters I rode today:
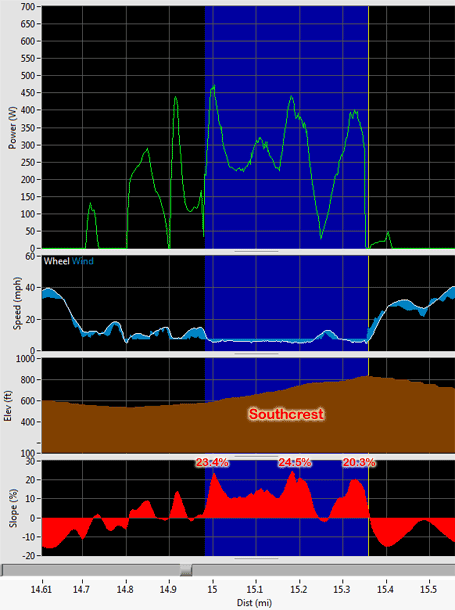
 Southcrest – stair stepper with three separate 20+% sections.
 Montclair (Trinity) – “The Ramp”.
 Woodcrest – very straight climb that flattens out just before the steepest pitch.
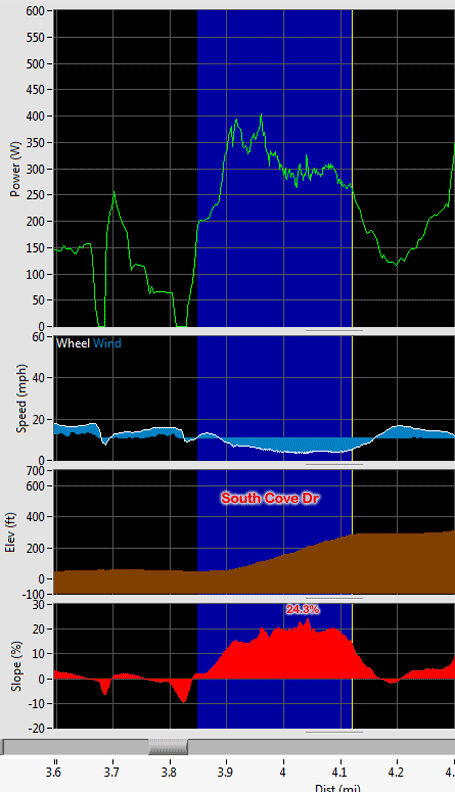
 South Cove Dr – less than a mile from my house, this climb has the highest average gradient of the monsters.
Here are the detailed statistics for the climbs on the ride.
---------ENTIRE RIDE---------
Dist:       38.39 mi (2:38:13)
Climbing:    5818 ft
Energy:    1513.9 kJ
Cals Burn: 1447.3 kcal
Braking:   -396.6 kJ (-26.2%) That's a LOT of braking!
          Min   Avg    Max
Power       0  159.5   688  W
Aero        0   38.7  1109  W
Rolling     0   19.3    69  W
Gravity -3402    0.6   727  W
Speed     0.0   14.6  52.7  mi/h
Elev      420    724  1167  ft
Slope   -19.9   0.01  24.5  %
Caden       0   73.8   115  rpm
HR         80  138.0   175  bpm
NP 223 W; IF 0.805; TSS 171.0
---------Southcrest Monster---------
Dist:        0.56 mi (0:04:37)
Climbing:     299 ft
Energy:      74.1 kJ
Cals Burn:   70.9 kcal
Braking:     -1.0 kJ (-1.3%)
          Min   Avg    Max
Power       0  267.6   474  W
Aero        0    9.9    60  W
Rolling     6    9.7    20  W
Gravity  -240  238.1   439  W
Speed     4.6    7.3  15.1  mi/h
Elev      747    891  1048  ft
Slope    -6.6   9.58  24.5  %
Caden       4   60.9   107  rpm
HR        104  149.4   164  bpm
NP 295 W; IF 1.063; TSS 8.7
---------South Cove Dr Monster---------
Dist:        0.22 mi (0:02:50)
Climbing:     229 ft
Energy:      52.0 kJ
Cals Burn:   49.7 kcal
Braking:      0.0 kJ (0.0%)
          Min   Avg    Max
Power     226  306.0   403  W
Aero        0   10.9    17  W
Rolling     5    6.3    10  W
Gravity   198  291.0   385  W
Speed     3.5    4.8   7.6  mi/h
Elev       512    634   740  ft
Slope     9.0  18.01  24.3  %
Caden      31   41.3    65  rpm
HR        132  158.3   165  bpm
NP 309 W; IF 1.114; TSS 5.9
---------Montclair - Trinity Monster---------
Dist:        0.38 mi (0:02:56)
Climbing:     212 ft
Energy:      50.6 kJ
Cals Burn:   48.4 kcal
Braking:      0.0 kJ (0.0%)
          Min   Avg    Max
Power      84  287.5   429  W
Aero        0    8.5    13  W
Rolling     7   10.4    16  W
Gravity   167  276.2   410  W
Speed     5.4    7.9  12.4  mi/h
Elev      775    874   988  ft
Slope     4.1  10.28  21.8  %
Caden      48   64.8    86  rpm
HR        117  146.9   162  bpm
NP 292 W; IF 1.052; TSS 5.4
---------Woodcrest Monster---------
Dist:        1.91 mi (0:10:31)
Climbing:     478 ft
Energy:     149.2 kJ
Cals Burn:  142.6 kcal
Braking:     -7.3 kJ (-4.9%)
          Min   Avg    Max
Power       0  236.4   451  W
Aero        0   29.5   223  W
Rolling     0   14.5    31  W
Gravity  -323  174.5   435  W
Speed     0.0   10.9  23.1  mi/h
Elev      672    759   981  ft
Slope    -8.6   4.68  21.4  %
Caden       0   72.1   111  rpm
HR        104  152.5   172  bpm
NP 277 W; IF 0.998; TSS 17.4
Note – to put South Cove Dr in perspective for the Birmingham riders who know Elder St, think about this – South Cove Dr climbs an additional 80 ft over roughly the same distance as Elder!
---------Elder St Mini-Monster---------
Dist:        0.20 mi (0:02:00)
Climbing:     149 ft
Energy:      36.1 kJ
Cals Burn:   34.5 kcal
Braking:      0.0 kJ (0.0%)
          Min   Avg    Max
Power       0  300.8   403  W
Aero        0    8.1    77  W
Rolling     6    8.0    25  W
Gravity    85  283.1   386  W
Speed     4.9    6.1  18.9  mi/h
Elev      686    765   837  ft
Slope     1.3  13.72  19.2  %
Caden      44   51.6   105  rpm
HR        131  151.8   160  bpm
NP 314 W; IF 1.130; TSS 4.3
---------Stone River Mini-Monster---------
Dist:        0.29 mi (0:02:45)
Climbing:     200 ft
Energy:      49.0 kJ
Cals Burn:   46.8 kcal
Braking:      0.0 kJ (0.0%)
          Min   Avg    Max
Power     219  296.9   359  W
Aero        0    6.8    10  W
Rolling     6    8.3    12  W
Gravity   182  279.4   348  W
Speed     4.8    6.3   8.9  mi/h
Elev      717    821   917  ft
Slope     5.9  13.01  16.3  %
Caden      42   55.1    78  rpm
HR        133  151.8   163  bpm
NP 298 W; IF 1.074; TSS 5.3
---------Cahaba River to Vestavia Dr High Pt---------
Dist:        5.45 mi (0:23:33)
Climbing:     988 ft
Energy:     318.3 kJ
Cals Burn:  304.3 kcal
Braking:    -20.1 kJ (-6.3%)
          Min   Avg    Max
Power       0  225.2   557  W
Aero        0   54.9   385  W
Rolling     1   18.4    37  W
Gravity  -685  124.5   523  W
Speed     0.4   13.9  28.0  mi/h
Elev      420    724  1167  ft
Slope    -8.5   2.62  14.8  %
Caden       0   79.8   107  rpm
HR        109  146.1   175  bpm
NP 261 W; IF 0.940; TSS 34.7
Leave a Reply