Pumphouse KOM power analysis

Posted

in

Wow, what a week this has been for the Strava KOM shoot-out. I thought for sure I had Pumphouse signed, sealed, and delivered – but no – Paul “TreeTrunk” Tower came along today and set down a blistering time of 2’22” with an average speed of 20.4mph on the 0.8 mile climb. Still, here is the data from my 2’25” effort (20.0mph) yesterday, which put a bulge in my Golden Cheetah critical power curve: (I can only imagine what Paul’s power must have looked like since he weighs a few pounds more than me!)
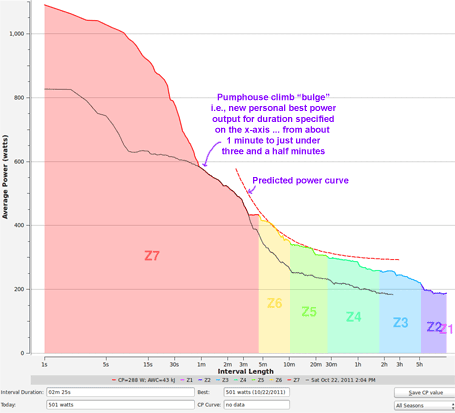
Pumphouse KOM attempt critical power curve

Pumphouse KOM attempt data plot

Comments

7 responses to “Pumphouse KOM power analysis”

  1. Ed Merritt Avatar

    Depending on the direction of my research when I get a faculty position somewhere, I think it would be awesome to take a deeper look at all of your data. Theoretically, there should be 3 distinct regions on a power curve like the one you have displayed…one for each energy system used by the muscle (if you care about ex phys type stuff those are CPK, glycolysis, oxidative phos.). Cycling is really interesting in this perspective b/c nearly all cyclists are endurance athletes, but some excel at TT’s, others at climbing, and others in sprints, so it’d be neat to see how the individual power curve changes between specialists. Cycling is also awesome b/c so many cyclists are data nerds and have all of these files (and it’s way easier to get power measurements as opposed to swimming or running). Anyway…I could talk about it for a long time, but i’ll stop now, but keep saving all that data…and let me know when I can get some muscle biopsies from you.

  2. kartoone Avatar
    kartoone

    Sounds great! I’ve tried to incorporate cycling data into some of my research from the computer science side of things. One of the things that I am interested in is how to create an algorithm that can predict the best “line” up a climb … i.e., do you cut the corner for shorter distance/steeper gradient or do you go the long way around for longer distance/easier gradient? It seems like this is a really complicated question and is athlete specific – but I’m wondering if you have detailed power history combined with super accurate elevation data, could an algorithm predict the best line for a climb with lots of switchbacks.

  3. jacob Avatar
    jacob

    Nice work Brian.

    One thing that I think about a lot is how analysis is only as good as the data. I think the data recorded by the Garmin devices is generally pretty good, or at least consistent. By comparison, the iPhone is generally pretty terrible. Look at the elevation plot recorded by Paul’s iPhone on his Pumphouse KOM, then compare to yours. Something aint right there…

    1. Paul Avatar
      Paul

      I was using Nichole’s Garmin when I did Pumphouse, not my iphone 🙂

      1. kartoone Avatar
        kartoone

        Yes, I saw that from facebook, but she has a garmin forerunner 405 – those don’t have barometric pressure readings either so it would still use the usgs elevation data (i think!) https://buy.garmin.com/shop/shop.do?pID=11039&ra=true#specsTab If it the underlying elevation data was more accurate, then the Strava calculated power would be more accurate since it is reliant totally on the elevation data. Either way – amazing job on the KOM – 20.4 mph on a nearly 5% climb is definitely pro peloton worthy. The only thing is that those dudes can hold that speed for miles and miles instead of 0.8 miles like us.

  4. kartoone Avatar
    kartoone

    Thanks Jacob – I agree – actually, that goes back a little bit to my dissertation research about the trustworthiness of data sources. It would be interesting to build a program to take all of the power data from a rider and automatically detect anomalies that indicate the power meter wasn’t working correctly — or for the dreaded “d” word. I think this is sort of what Greg Lemond was advocating.

    About Paul’s data – I’m pretty sure it is derived from the underlying usgs elevation data that strava puts in for devices that don’t have barometric altimeters. So it is funky because the usgs data that strava is using is not very accurate and doesn’t account for the grading of the road when it was built. But the timing on his data looks accurate because that is only dependent on the GPS signal and where strava matches the start/end of the ride.

  5. Chad Williamson Avatar
    Chad Williamson

    @Ed…right on about excelling at different things…especially when you compare pure cyclists to triathletes. as a triathlete (and probably for most triathletes), my power curve has always been pretty flat…my high end power (like 0-5 minutes) is not that great, but anaerobic threshold or 60MP is pretty high (relative to my 5MP). so when I started doing this Strava shootout thing…going hard for say, ~2-5 minutes, it has been sooo painful because I rarely work at those kinds of power outputs for those kinds of durations!! I can tell i’ve been adapting to it even in the past 2-3 weeks though, which is pretty cool. the human body is so fascinating in the way it adapts to physical stimuli.

Leave a Reply

Your email address will not be published. Required fields are marked *