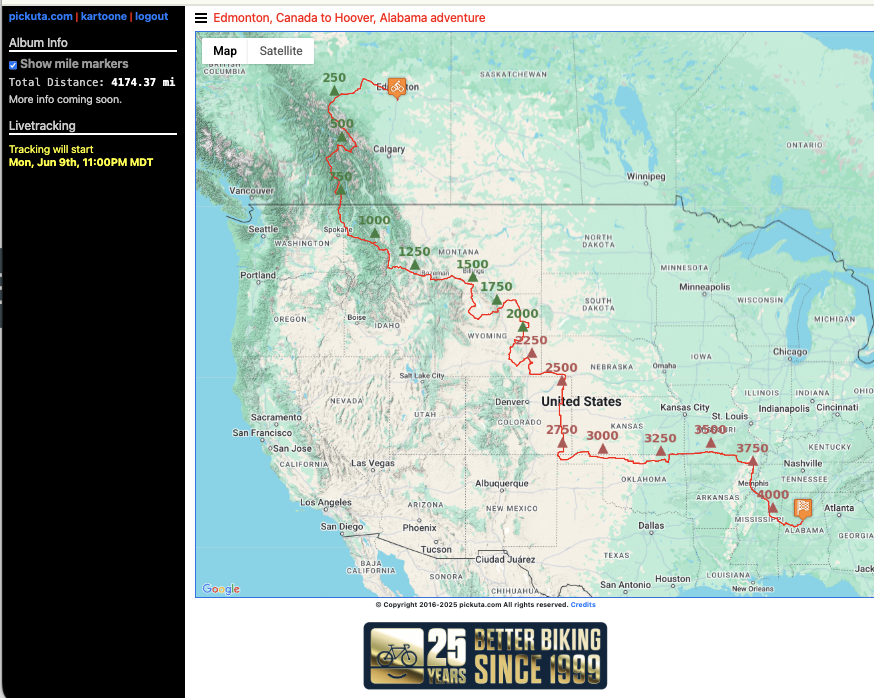
Tomorrow is the big day! The featured post image above is a map of my 4,173 mile route from Edmonton, Canada to Hoover, Alabama riding in two Canadian provinces, and 14 American states.
The goal is 1) adventure and 2) data … so I am calling this my Canadian-American Data Adventure. I am raising funds for https://peopleforbikes.org as they are a great organization helping improve the cycling infrastructure here in the USA.
Lateral Passing Data
I have been collecting vehicle data on https://mybiketraffic.com for many years now. I have traffic volume and speed data from rides from all over the world (98 countries). But I do not have any lateral passing data, which is a new feature I plan to add later this summer. Check out all my existing data here:
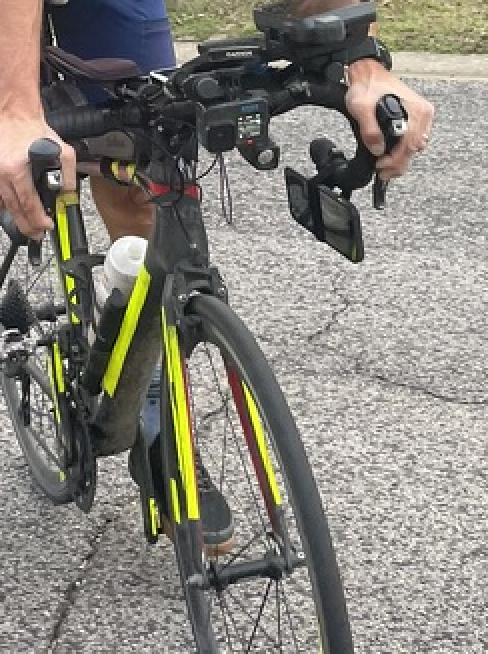
The primary data I will be collecting is lateral passing data from vehicles as they pass me on the ride. I will post a detailed analysis of all the data from this one ride along with an explanation of my setup. But as a TLDR, I wrote an iOS app that connects directly to the Garmin Varia radar. When a car gets within a few meters of passing, the iOS app starts snapping images and LiDAR depth maps at 4 frames per second. This is usually good enough to get three frames and depth maps of a car as it passes. A picture of my setup is shown below.

Live Tracking
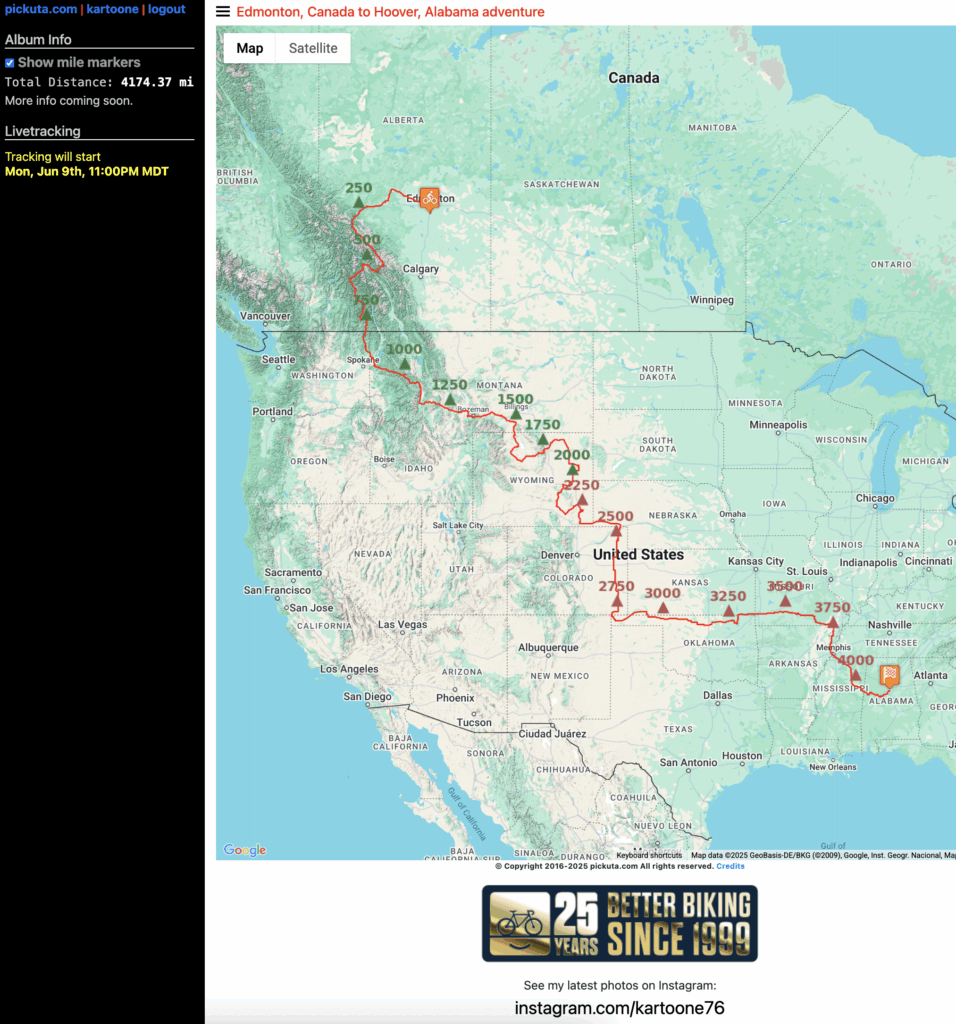
I am so excited about this trip. I will be posting about a million pictures every day (slight exaggeration) to this website where you can not only see the pictures but see my progress. A small stopwatch clock will appear every time my satellite tracker uploads my location (approximately once every 10 minutes). You can click “pickuta.com” in the top left to see a list of my other adventures to see pictures and what the tracking looks like.
Leave a Reply