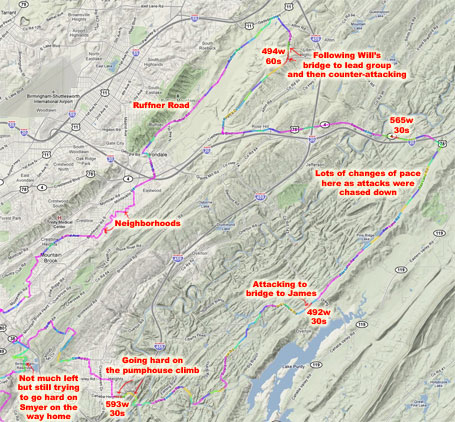
My schedule was freed up enough for me to ride the Tuesday Worlds ride tonight leaving from Bob’s Bikes. Great people, great ride, great training. Definitely makes for a very colorful power map thanks to Golden Cheetah (excellent software).
I’ll write up more about Golden Cheetah when I have time, but I am wondering if anyone else has used it and observed trends in their Pedal Force / Pedal Velocity graphs. I seem to get very different data when racing vs training … see graphs below
 Blue/green circles are during the 8/16/11 Tuesday Worlds race ride. Note the vertical orientation.
 Georgia Cycling Gran Prix Covington Criterium – Saturday, 7/23/11 – vertical orientation

 Red circles are during my climbing and riding before the Tuesday worlds ride. Note the diagonal orientation that matches the expected curve.
 Georgia Cycling Gran Prix Time Trial – Saturday, 7/23/11 – mostly vertical orientation, slightly sloping in expected direction
 Crossroads Classic – Salisbury Circuit Race – 8/7/11 – note the reverse trend sloping in exactly opposite than expected direction
Leave a Reply