With all that is happening in cycling right now, I definitely appreciate everyone who continues to follow my racing. I have never used any kind of performance enhancing drug, and it makes me sad/mad that so many of the stars of cycling from my generation have resorted to that during their careers. I think Phil Gaimon captured exactly how I feel when he describes Racer X at the end of this Velonews article. I will always love racing and riding my bike, so nothing changes for me in the wake of all that is coming out in the news now, other than a sense of responsibility to help promote clean sport. I’m not sure how or what difference I can make, but I’m open to suggestions and will continue looking for opportunities to help.
End of the season statistics
These statistics all run from October 31, 2011 until October 28, 2012 – 364 days worth of riding and racing. I define my racing/training season from the Monday closest to Nov 1 of the previous year to the Sunday closest to Oct 31st of the current year for all of these statistics and reports. The Polar Protrainer software makes it easy to calculate the statistics over the exact date range that I want to use.
Statistics Summary
October 31, 2011 – October 28, 2012
| Statistic | Avg | Max | Min | Total |
|---|---|---|---|---|
| Weekly training time (hours) | 25.68 | 40.87 | 15.4 | 1336.3 |
| Weekly distance (miles) | 389.8 | 648.6 | 255.8 | 20,271 |
| Workouts per week (#) | 12 | 19 | 6 | 632 |
| Weekly climbing (feet) | 44,199 | 89,354 | 17,936 | 2,298,327 |
For eagle-eyed observers who note that the climbing total is lower than that reported on Strava, I will give the same explanation that I gave last year: I am generating these reports from my Polar Protrainer software. I wrote a converter that converts Garmin .FIT files and .TCX files into the .HRM format that Polar expects. The Polar Protrainer software then applies a smoothing filter when it is calculating total ascent and other statistics, but I can’t figure out how to turn it off so that the statistics match up with Strava, which doesn’t apply any smoothing filters.
Some weekly milestone totals (from Strava):
- 3 weeks with more than 500 miles of riding, including one 648.6 mile week
- 25 weeks with more than 400 miles of riding
- 26 weeks with more than 50,000 ft of climbing, including a week with 100,342 ft
- 34 weeks with more than 25 hours of training/racing
Other statistical highlights (from Strava):
- Approximately 640 different KOMs on Strava
- A 249 mile mega ride to win the one-day Rapha Rising challenge with over 42,000 ft of climbing. I had some Garmin problems towards the end of the day and ended up losing 24 miles and 4,000 feet of climbing — but it was still enough to win the competition!
Comparison to past years
All years run from the Monday closest to November 1st to the Sunday closest to October 31st. This should result in about 365 days for each year give or take a day or two.
| Statistic (per week) |
2008 Avg/Max |
2009 Avg/Max |
2010 Avg/Max |
2011 Avg/Max |
2012 Avg/Max |
|---|---|---|---|---|---|
| Training (hours) | 14.0/20.2 | 13.4/20.8 | 15.4/20.9 | 22.4/33.0 | 25.7/40.9 |
| Distance (miles) | 238.4/337.1 | 241.8/369.4 | 265.5/380.3 | 338.4/502.7 | 389.8/648.6 |
| HR avg (bpm) | 137/165 | 139/161 | 136/176 | 131/178 | 123/156 |
| Workouts (#) | 11/15 | 9/14 | 11/14 | 11/17 | 12/19 |
| Climbing (feet) | 12.7k/20.3k | 13.5k/29.3k | 14.4k/22.8k | 30.7k/52.2k | 44.2k/89.4k |
| Statistic (yearly total) |
2008 Total |
2009 Total |
2010 Total |
2011 Total |
2012 Total |
|---|---|---|---|---|---|
| Training (hours) | 726 | 698 | 798 | 1,167 | 1,336 |
| Distance (miles) | 12.4k | 12.6k | 13.8k | 17.6k | 20.3k |
| Workouts (#) | 560 | 4451 | 546 | 580 | 632 |
| Climbing (feet) | 661k | 677k | 750k | 1,598k | 2,298k |
1 When I first got my Garmin in November 2008 (which falls in the 2009 year), I was leaving my commutes as one ride. In other words, I would just stop the timer while I was at work and then start it back up for the return trip home.
Racing Season Summary
This season was another “best ever” season highlighted by winning the Tour de Tuscaloosa road race over a really strong field to claim the Pro/1/2 Alabama state road race championship, having my best finish ever in the Athens Twilight criterium (20th place), winning the 47 day Strava climbing challenge sponsored by Specialized (my 20th place at Athens Twilight was near the end of that competition), placing 11th in the elite national road race in Augusta, making the podium three times at the Georgia Cycling Gran Prix including third overall for the five day omnium, and doing well in my first real foray into mountain bike racing since high school and college (3rd at Southern Cross, 2nd at the Skyway Epic, 4th at the Barn Burner in Flagstaff, 39th at Leadville in Colorado, and 13th at Fool’s Gold).
We did a lot of traveling over the summer, including a long road trip out to Arizona for a cousin’s wedding, that included the Barn Burner mountain bike race in Flagstaff and the three-day Tulsa Tough criterium series in Tulsa, Oklahoma on the way home. I had slightly disappointing results at the Tulsa Tough, but it was still one of the funnest weekends of racing the whole year — especially with the Tour de France like climb through the crowds every lab on Cry Baby Hill on the last day of racing. Another great adventure that didn’t quite have the results I was looking for was the Leadville Trail 100 MTB race. I ended up 39th but that was after bonking pretty bad about 75 miles into the 100+ mile race and struggling for the last 30 miles home. Still, the race itself was quite an adventure getting to race alongside two different world champions (Christoph Sauser from about mile 30 to mile 40 and Rebecca Rusch briefly on the powerline climb as she blew by me at mile 75). Altogether, I raced in ten different states this year (AZ, CO, OK, LA, MS, AL, TN, GA, FL, SC) over a total of 41 days covering 2,996 miles.
Two new screenshots this year from Golden Cheetah … both “metrics” graph which highlights my best power output for a given time. This is like a discrete version of the Critical Power graph focusing on some well-known time intervals.
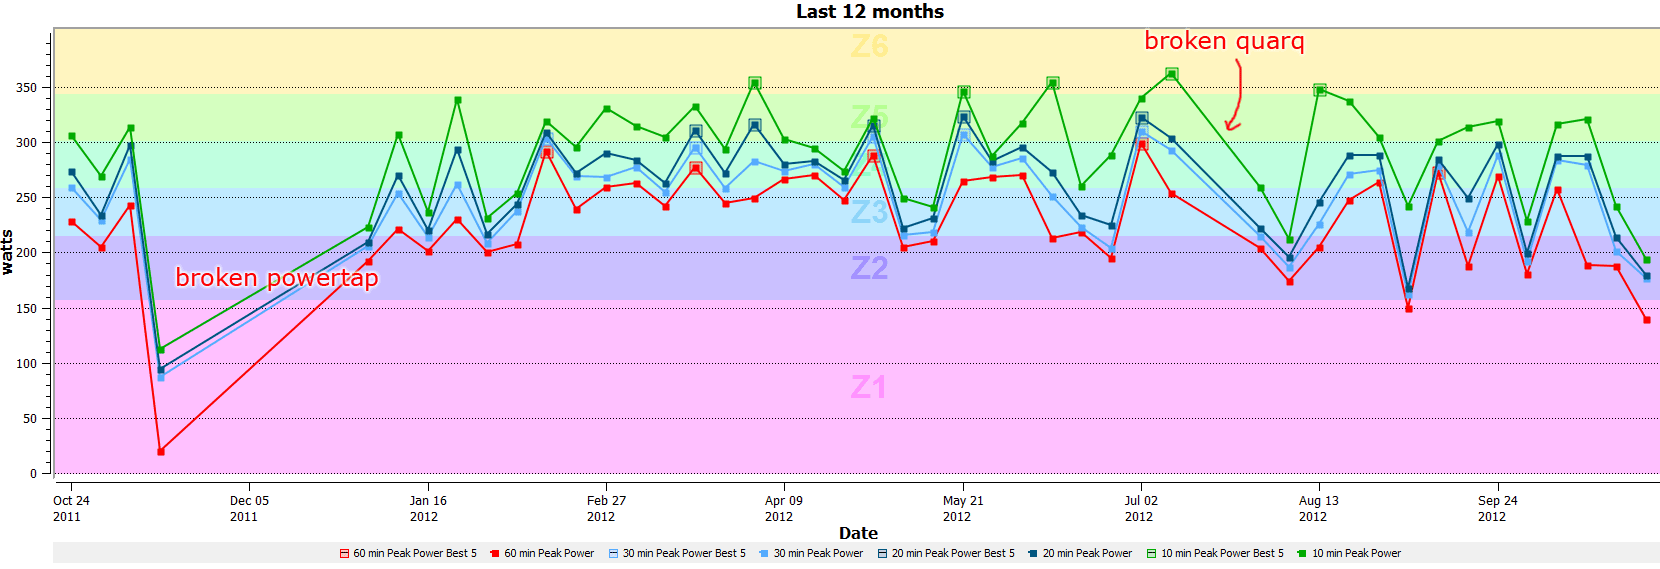 Aerobic power (best effort over longer time intervals). (click to enlarge)
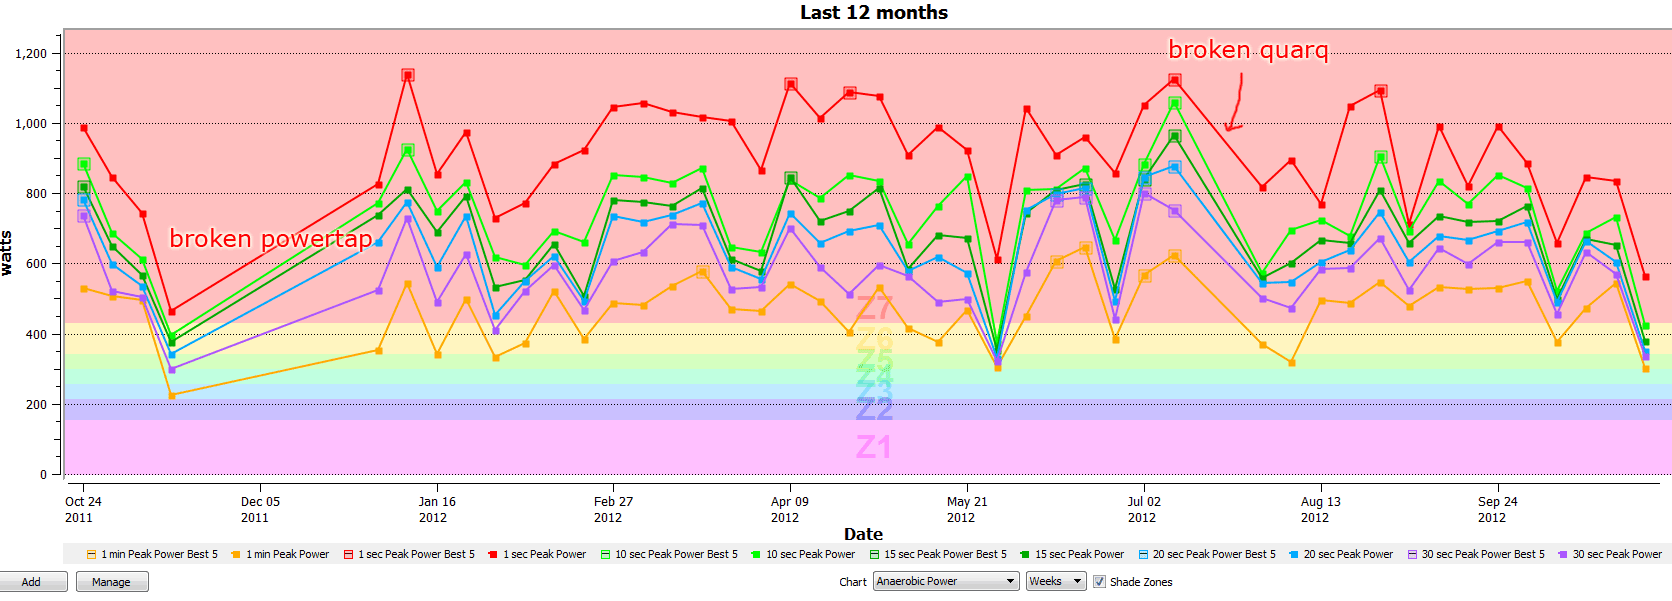 Anaerobic power (best efforts over shorter intervals). (click to enlarge)
And finally, finally, some more thank you’s
A huge thank you to first of all my beautiful wife, Kristine Toone, and my kids Analise and Josiah, my parents and all of my teammates, friends, and family. I’ll be working over the rest of the week on a separate post with more maps of all the places that we traveled, all the places where we have stayed for races, and all the places where I have ridden this year. In that post, I’ll thank people by name who have helped out so much. Just as last year, I’ll leave this exceedingly long post with just one more thanks – thanks!
 A picture is worth a thousand words so let’s start this long post out with a picture! My win at the Tour de Tuscaloosa road race to claim the Alabama state championship was definitely the highlight of my season. The inset pictures are the Alabama medals podium from Tuscaloosa as well teammates Boris and Kevin at the Pensacola stage race.
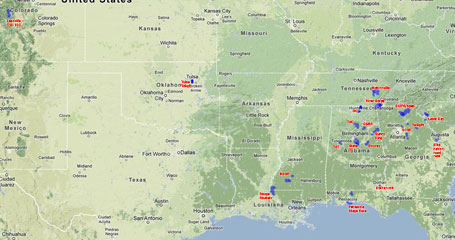 Map showing the locations of all my 2012 races (click to enlarge). Over 3000 miles of racing in 10 states. I just realized I acccidentally left Arizona off the map because I lost my Garmin during the Barn Burner race so I didn’t have any data from that race to pull into topocreator.
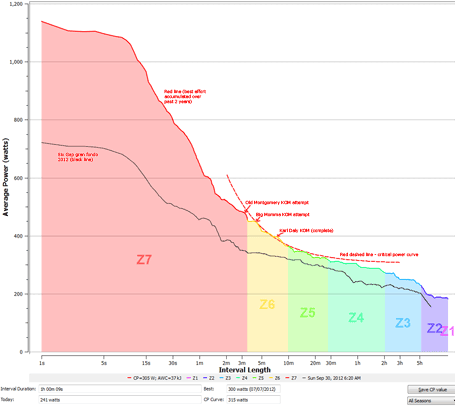 Critical power curve for 2012. This represents an increase from 288 watts in 2011 to 305 watts in 2012. This is QUITE a substantial increase, but it’s mainly because I didn’t have very much power data for 2011 to base my 2011 figure on. It only takes one GOOD effort to push the curve up, and I believe that effort for me was when I set the Karl Daly KOM (on June 16, 2012). (click to enlarge)
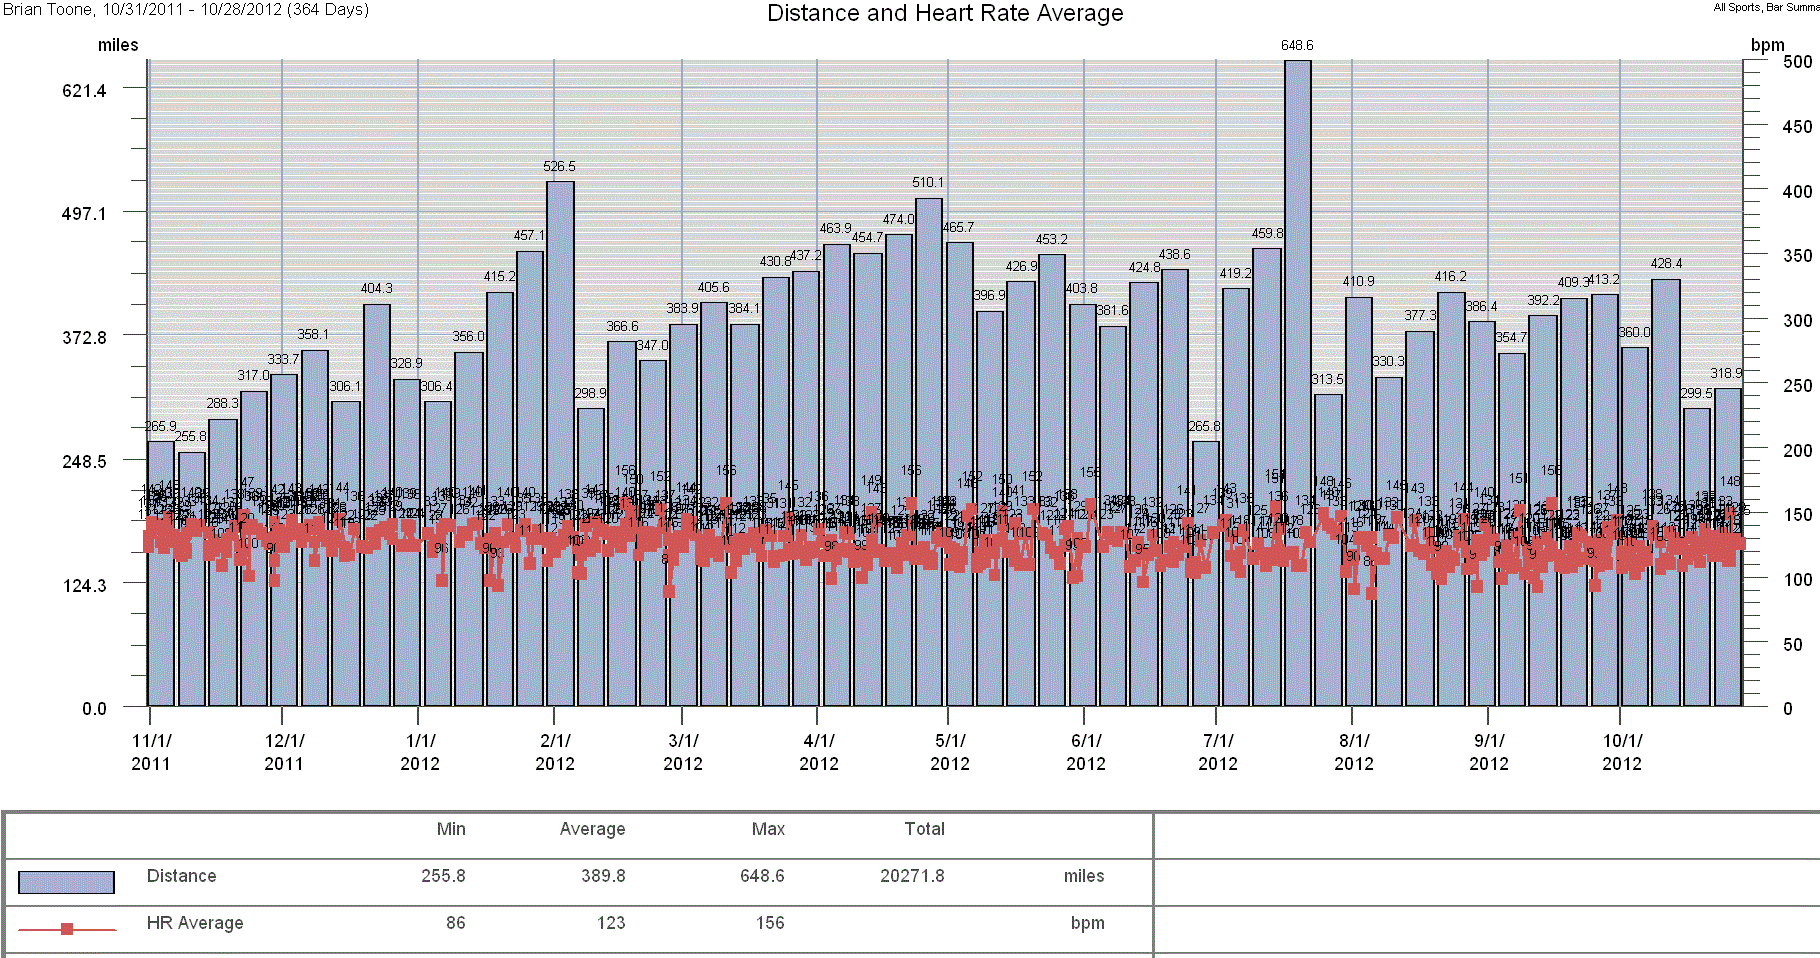 Much of my training is “distance-based” in that I aim for a particular weekly mileage. (click to enlarge)
 I also spend a lot of time focused on climbing … usually this my daily focus as I will set a minimum amount that I want to climb that day and then ride as long as it takes to hit that amount. As it gets closer to the end of the week, I see what I need to do in terms of mileage to bring me up to the desired weekly mileage. (click to enlarge)
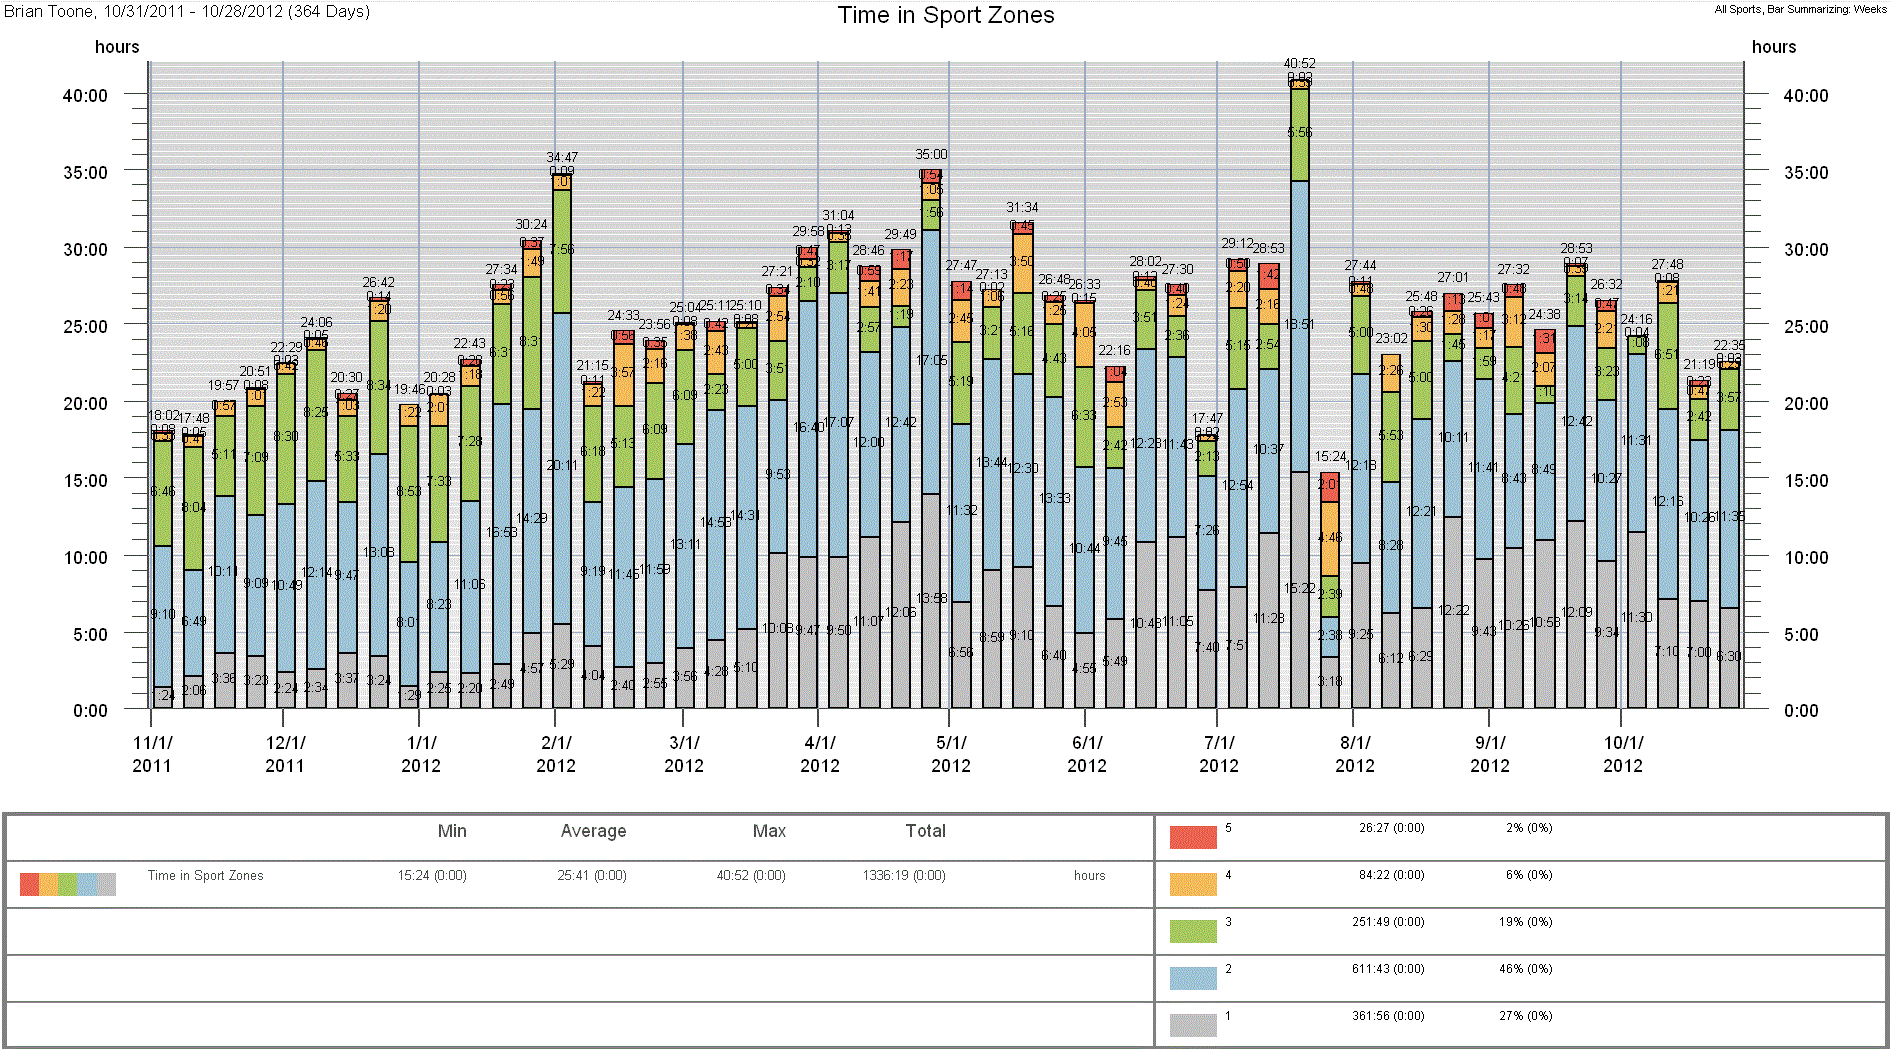 I rarely think about total time when training, but I do concern myself with time spent in different heartrate zones (particularly in the off season and base training period). I want to make sure I’m spending the right amount of time in the “red zone”. During the racing season, the race tactics that play out govern how much time is spent in the red. I aim NEVER to get into zone 4 or 5 during training during the racing season since I am racing pretty much every weekend where I spend a LOT of time in those zones. (click to enlarge)
 You can see when school is in session because my “number of workouts” goes up dramatically since I have at least two rides per day (my commutes) during the school year.
Leave a Reply